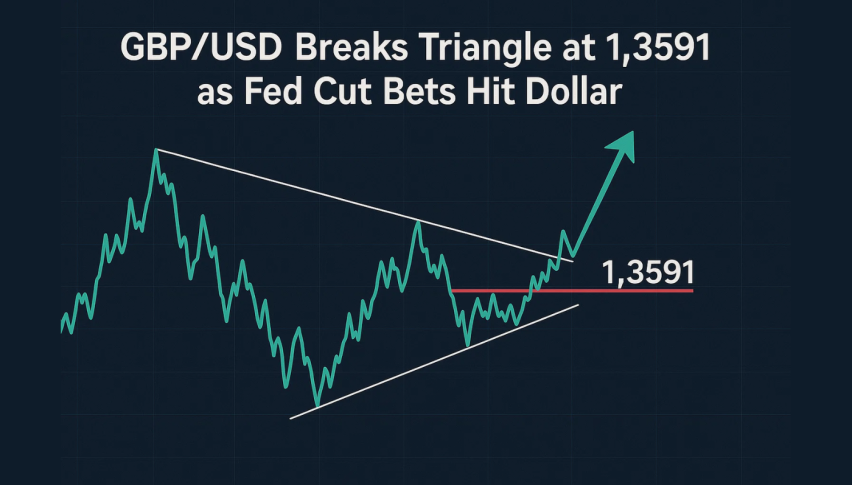
GBP/USD Breaks Triangle at 1.3591 as Fed Cut Bets Hit Dollar
The GBP/USD pair climbed to 1.3579 in early European trading Monday, bolstered by mounting expectations that the Federal Reserve...
Quick overview
- The GBP/USD pair rose to 1.3579, driven by expectations of a Federal Reserve rate cut this week.
- Despite the recent strength, the British Pound faces challenges from disappointing UK economic data.
- Technically, GBP/USD has broken out of a symmetrical triangle, indicating potential bullish momentum.
- Traders are advised to buy dips near 1.3560–1.3570, targeting higher levels if momentum continues.
The GBP/USD pair climbed to 1.3579 in early European trading Monday, bolstered by mounting expectations that the Federal Reserve will deliver its first rate cut of the year at this week’s September policy meeting. According to the CME FedWatch Tool, markets now assign a near 100% probability of a 25-basis-point reduction, with some even pricing in a larger move.
Fed Chair Jerome Powell has reiterated that policy remains data-dependent, keeping attention fixed on Wednesday’s Summary of Economic Projections (SEP) for clues on the path of future cuts. A dovish tone could further pressure the US Dollar, helping the Pound extend gains.
UK data keeps pressure on GBP
Despite near-term strength, the British Pound faces headwinds from weaker domestic data. July GDP and factory output undershot expectations, stoking concerns about sluggish growth. Markets are now pricing a 33% chance of a Bank of England rate cut later this year, limiting the Pound’s upside momentum.
This mixed backdrop leaves GBP/USD trading in a tug-of-war: US Dollar weakness supports the pair, while UK fundamentals cap the rally.
GBP/USD Technical outlook: breakout in play
Technically, GBP/USD has broken free from a symmetrical triangle, lifting above 1.3591 after weeks of consolidation. A sequence of higher lows since early September adds to the bullish case.
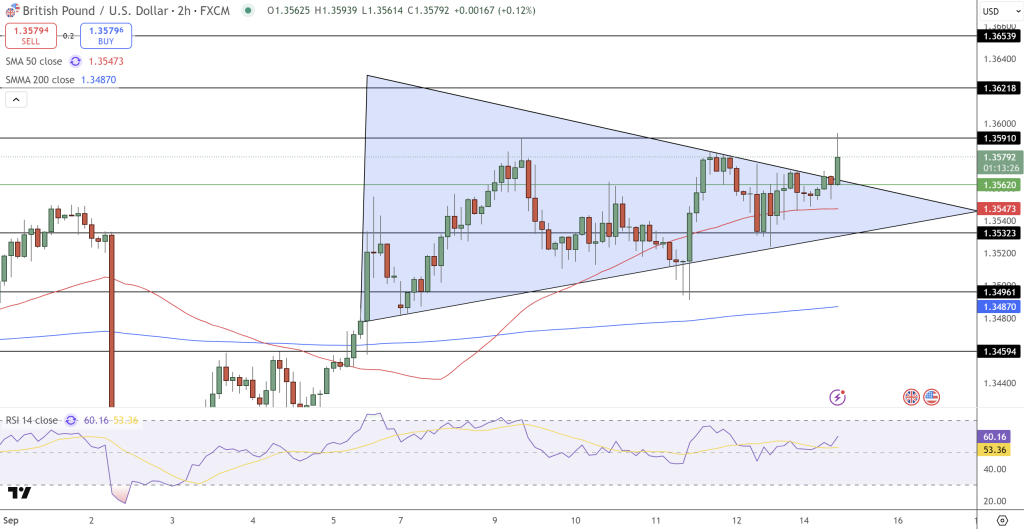
Key signals include:
- 50-EMA (1.3547) curling above 200-EMA (1.3487), hinting at a golden cross.
- Strong green candles replacing indecisive bodies, showing renewed demand.
- RSI at 60, firmly in bullish territory with no bearish divergence.
For traders, the strategy is straightforward: buy dips near 1.3560–1.3570 with a stop under 1.3530. Upside targets are 1.3621 and 1.3653 if momentum holds. For beginners, the triangle acts like a coiled spring—patience for a retest before entering reduces risk.
- Check out our free forex signals
- Follow the top economic events on FX Leaders economic calendar
- Trade better, discover more Forex Trading Strategies
- Open a FREE Trading Account
- Read our latest reviews on: Avatrade, Exness, HFM and XM
Related Articles


Sidebar rates
Related Posts
