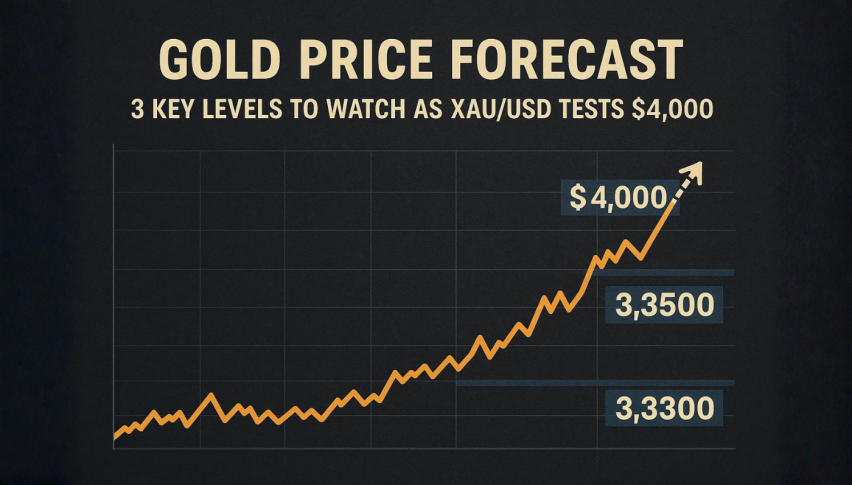
Gold Price Forecast: 3 Key Levels to Watch as XAU/USD Tests $4,000
Gold slid beneath the $4,000-per-ounce threshold again as the U.S. dollar held near three-month highs and the chance of a December...
Quick overview
- Gold prices fell below $4,000 per ounce as the U.S. dollar strengthened and the likelihood of a December Fed rate cut decreased.
- The Federal Reserve's recent rate cut has led to reduced market expectations for further cuts, impacting gold's appeal as a safe-haven asset.
- Technically, gold is holding an ascending trendline, indicating potential bullish control, but is currently in a consolidation phase.
- Traders should watch for key price levels and Fed commentary, as these could significantly influence gold's market direction.
Gold slid beneath the $4,000-per-ounce threshold again as the U.S. dollar held near three-month highs and the chance of a December rate cut by the Federal Reserve (Fed) shrank.
The Fed’s recent rate cut was its second this year, yet Chair Jerome Powell cautioned that further reductions are “not a foregone conclusion.” Market odds for another cut have dropped to around 65 %, down from above 90 % before Powell’s remarks.
This matters because higher real interest rates tend to weigh on non-yielding assets like gold, so with fewer rate cuts priced in and a firm dollar, bullion’s safe-haven appeal is muted.
Gold (XAU/USD) Technical Outlook: Trendline Holding
On the 4-hour chart, gold is holding an ascending trendline that dates back to early September, which suggests bulls are still in control of the higher-low structure. Price has been caught in a narrow range, roughly between $3,977 and $3,999, just under the 20-period EMA, which has flattened, a classic sign of consolidation rather than a clear breakout.
Recent candlesticks, tiny bodies, spinning tops—reflect indecision between buyers and sellers. The RSI is around 49, subtly curling upward but without a clear bullish divergence. If the trendline near $3,885 remains intact, the setup points to a coiling pattern—a possible rising-triangle scenario.

From here:
- A strong close above $4,038 could open the path toward $4,142, then $4,247.
- A breakdown below $3,886 would break the higher-low sequence and likely trigger a slide toward $3,796.
What Traders Should Watch
- A breakout above $4,038 + rising volume = bullish cachet.
- A close below $3,886 = danger to bullish posture.
- Monitor Fed commentary and U.S. employment data—these may change the tone faster than numbers.
- Maintain stop-loss discipline: if the triangle fails, momentum can swing quickly.
In short: gold is not broken, but it’s waiting. The structure is in place, but the catalyst has yet to land.
- Check out our free forex signals
- Follow the top economic events on FX Leaders economic calendar
- Trade better, discover more Forex Trading Strategies
- Open a FREE Trading Account
- Read our latest reviews on: Avatrade, Exness, HFM and XM
Related Articles


Sidebar rates
Related Posts
