Prices Forecast: Technical Analysis
For the daily forecast, Chainlink is expected to close around $13.36, with a potential range between $12.18 and $14.54. On a weekly basis, the closing price is anticipated to be approximately $13.88, with a range from $12.7 to $15.06. The RSI at 40.3116 suggests a neutral to slightly bearish sentiment, indicating potential for a price rebound if oversold conditions are reached. The ATR of 0.882 points to moderate volatility, suggesting that price swings could be contained within the predicted range. The ADX at 19.484 indicates a weak trend, implying that significant directional moves are unlikely without new catalysts. The MACD line is below the signal line, reinforcing a bearish outlook in the short term. However, the proximity to support levels could attract buying interest, potentially stabilizing prices.
Fundamental Overview and Analysis
Chainlink’s recent price trends show a decline, with the last closing price at $13.22. This reflects broader market volatility and investor caution. Factors influencing Chainlink include its role in decentralized finance (DeFi) and smart contracts, where demand for reliable data feeds is crucial. Investor sentiment is cautious, as indicated by the RSI and MACD, but the asset’s technological advancements and partnerships offer growth potential. Risks include competition from other oracle providers and regulatory scrutiny in the crypto space. Currently, Chainlink appears fairly priced given its market position and potential for adoption. However, market participants are wary of macroeconomic factors, such as consumer sentiment, which could impact broader crypto market dynamics.
Outlook for Chainlink
Chainlink’s future outlook is influenced by its integration into DeFi and blockchain ecosystems. Short-term price movements (1 to 6 months) are likely to be influenced by macroeconomic conditions and crypto market sentiment. The asset could see moderate growth if it continues to secure partnerships and expand its use cases. Long-term forecasts (1 to 5 years) suggest potential for significant appreciation, driven by increased adoption of blockchain technology. However, external factors like regulatory changes or technological disruptions could impact its trajectory. Investors should monitor economic indicators and industry developments closely, as these will play a crucial role in shaping Chainlink’s price movements.
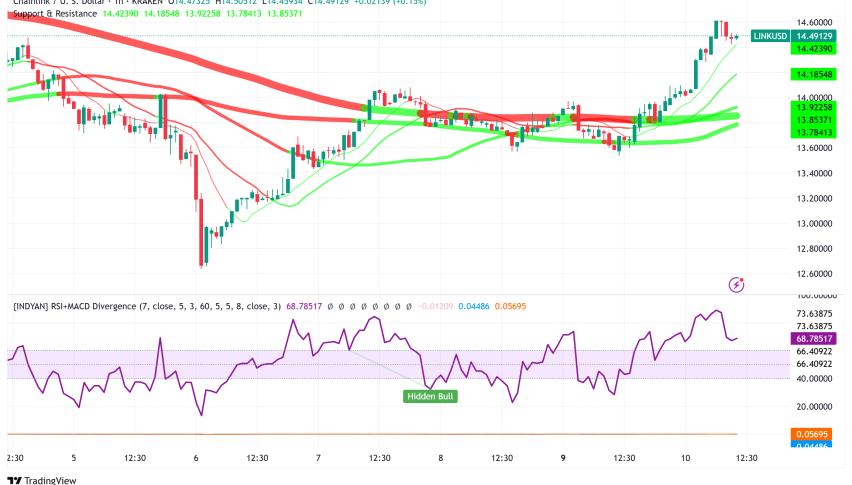
Technical Analysis
Current Price Overview: Chainlink’s current price is $13.22, slightly down from the previous close of $13.22. Over the last 24 hours, the price has shown a downward trend with moderate volatility, as indicated by the ATR. Support and Resistance Levels: Key support levels are at $12.7, $12.18, and $11.52, while resistance levels are at $13.88, $14.54, and $15.06. The pivot point is at $13.36, with the asset trading slightly below it, suggesting a bearish sentiment. Technical Indicators Analysis: The RSI at 40.3116 indicates a neutral to bearish trend. The ATR of 0.882 suggests moderate volatility. The ADX at 19.484 shows a weak trend, indicating limited directional strength. The 50-day SMA and 200-day EMA do not show a crossover, suggesting no significant trend change. Market Sentiment & Outlook: Sentiment is currently bearish, as the price is below the pivot, and the RSI and ADX suggest weak momentum. The lack of a moving average crossover further supports this outlook.
Forecasting Returns: $1,000 Across Market Conditions
Investing $1,000 in Chainlink presents various scenarios based on market conditions. In a Bullish Breakout scenario, a 10% price increase could raise the investment to approximately $1,100. In a Sideways Range scenario, the price might remain stable, keeping the investment around $1,000. In a Bearish Dip scenario, a 10% decrease could reduce the investment to about $900. These scenarios highlight the importance of market conditions in determining investment outcomes. Investors should consider their risk tolerance and market outlook before making decisions. Diversification and staying informed about market trends can help mitigate risks and optimize returns.
| Scenario | Price Change | Value After 1 Month |
|---|---|---|
| Bullish Breakout | +10% to ~$14.54 | ~$1,100 |
| Sideways Range | 0% to ~$13.36 | ~$1,000 |
| Bearish Dip | -10% to ~$12.18 | ~$900 |
FAQs
What are the predicted price forecasts for the asset?
The daily closing price for Chainlink is predicted to be around $13.36, with a range between $12.18 and $14.54. The weekly forecast suggests a closing price of approximately $13.88, with a range from $12.7 to $15.06.
What are the key support and resistance levels for the asset?
Key support levels for Chainlink are at $12.7, $12.18, and $11.52. Resistance levels are identified at $13.88, $14.54, and $15.06. The pivot point is at $13.36, with the asset currently trading below it.
What are the main factors influencing the asset’s price?
Chainlink’s price is influenced by its integration into DeFi and blockchain ecosystems, investor sentiment, and macroeconomic conditions. Technological advancements and partnerships also play a significant role in its valuation.
What is the outlook for the asset in the next 1 to 6 months?
In the short term, Chainlink’s price is likely to be influenced by macroeconomic conditions and crypto market sentiment. Moderate growth is possible if the asset continues to secure partnerships and expand its use cases.
Disclaimer
In conclusion, while the analysis provides a structured outlook on the asset’s potential price movements, it is essential to remember that financial markets are inherently unpredictable. Conducting thorough research and staying informed about market trends and economic indicators is crucial for making informed investment decisions.