Shiba Inu (SHIB) Price Prediction for 2022: Heading for a Dry Spell
Last Update: January 13th, 2022
Shiba Inu (SHIB) – Forecast Summary
| SHIB Forecast: H1 2022 Price:0.000045 – 0.000050 Price drivers: Cryptocurrency Market Sentiment, Tapering | SHIB Forecast: 1 Year Price: 0.000050 – 0.000090 Price drivers: US Fed Tapering, Crypto Market Recovery | SHIB Forecast: 3 Years Price:0.000090 – 0.00010 Price drivers: New Developments from SHIB, Renewed Crypto Optimism |
Current State of Shiba Inu (SHIB)
Shiba Inu (SHIB) hit new all-time highs in late October 2021 when it reached $0.0000880. But since then, SHIB’s price has been lethargic, shedding percentage gains daily, stair-stepping downwards weekly. And from the looks of it, we have not seen the bottom yet as the entire cryptocurrency market has been in a whirlwind of volatility as well.
Major cryptocurrencies like Bitcoin (BTC) and Ethereum (ETH) are now trading below their 200-day moving averages followed by most altcoins. This weakness in the overall market could be attributed to the announcement of faster tapering of the US Federal Reserve to curb inflation fears.
The news of tapering sucks out capital from the financial markets – bonds, equities, and cryptocurrencies. Money outflow would most likely begin flowing out of the riskiest financial instruments which is the cryptocurrency markets. This is what we are seeing now, a market-wide sell-off. At least for the first half of 2022, expect more pain before it gets better. Shiba Inu’s ride to the moon may take a step back for the meantime as the cryptocurrency dry spell begins.
Recent Changes in the SHIB Price
| Period | Price | Change ($) | Change (%) |
| 2 Weeks | 0.00003824 | -0.00000971 | -25% |
| 1 Month | 0.00003443 | -0.00000590 | -17% |
| 3 Months | 0.00002904 | -0.00000051 | -2% |
| 6 Months | 0.00000724 | 0.00002129 | 294% |
SHIB Live Chart
Shiba Inu Price Prediction for 2022
If 2021 ends on a bullish note, the 2022 SHIB trade might start at a bullish price of $0.000019. But if the price drops to minimums, it might lose momentum, as we move into next year’s trading. SHIB could start 2022 at a price of $0.000009.
As we know, the rumors about ShibaSwap already being launched, are spreading day by day, and the network is officially quoting audits for the project. If the SHIB’s own DEX gets launched and runs flawlessly by 2022, the price of Shiba Inu might hit $0.00003. But, if ShibaSwap does not become a practical reality, the average price for SHIB will be around $0.0000241.
On a different note, if PoW becomes a hot debating topic again, among several Crypto celebrities, a possible market crash could occur next year. In that way, we can expect the price to hit support levels at $0.0000193.
Shiba Inu Price Prediction for 5 Years:
Shiba Inu is more of a community-driven network, which puts the users on the cards for the altcoin. As a result, in the coming years, if it succeeds in maintaining a comparable technology, it could move at decent figures. By the end of the next five years, SHIB might trade at an average price of $0.0000561.
Monero Coin (XMR) Forecast for 2021: Will the XMR/USD Continue to Rise in 2021?
Ethereum (ETH) Price Prediction For 2021: Will Buyers Break 2017 Highs Soon?
Technical Analysis – SHIB/USD 23.6% Fibonacci Retracement Support
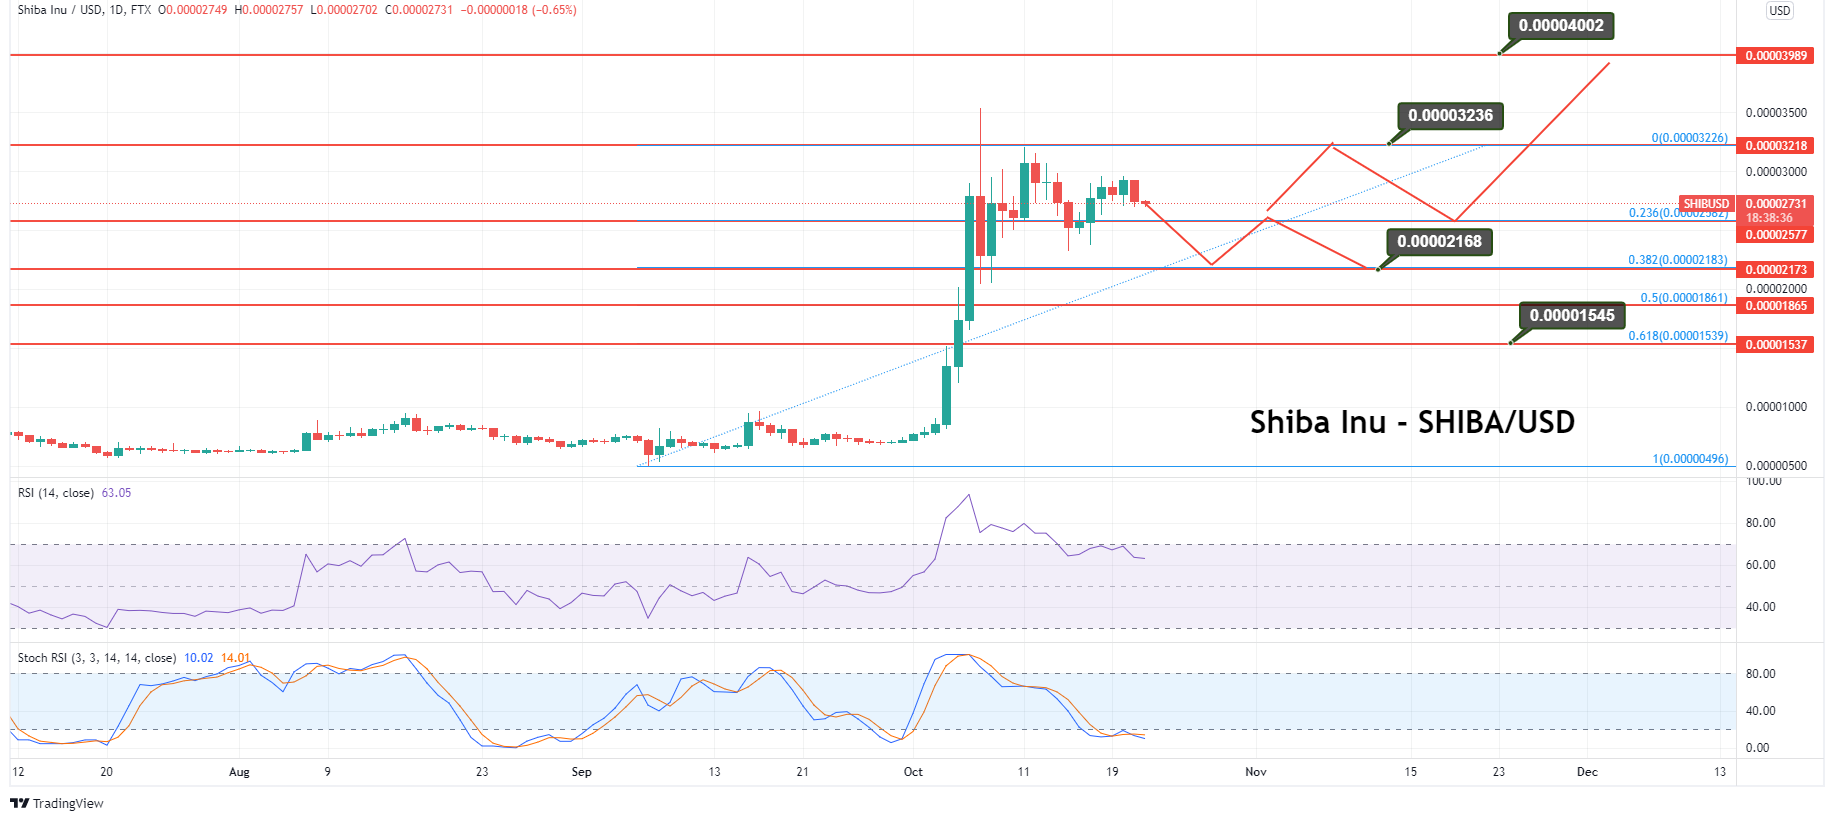
SHIB/USD has exhibited a strong bearish bias since May 2021, plunging from the $0.00004026 to the $0.00000818 level. On the technical front, the coin was consolidating within a narrow trading range between $0.00001101 and $0.00000525. However, it has already violated the narrow trading range and now it is trading at around $0.000027. The coin is holding above 20 and 50 periods EMA support levels. The leading technical indicators, the MACD (Moving average convergence divergence) and RSI (Relative Strength Index), are exhibiting a strong bullish trend in the crypto coin.
On the weekly time-frame, the MACD and RSI are holding above the mid-level (0 levels), and 50 respectively, which exhibits a strong bullish bias in the price. At the moment, the SHIB/USD is closing a series of neutral candles, which demonstrates indecision among investors. As you can see on the weekly chart, the coin is gaining immediate support at $0.000023 which is being extended by a 23.6% Fibonacci retracement level. Violation of this level could extend the selling trend until the $0.0000216 and 0.000015 levels, that mark the 38.2% and 61.8% Fibonacci retracement.

SHIB/USD – Weekly Time-frame – Choppy Trading Range Breakout
On the weekly time frame, SHIB/USD has closed a series of doji and shooting star candles that are likely to keep the pair in a choppy mode between $0.000032 and $0.00002168. A breakout of this range could trigger further buying or selling in SHIB. A bullish breakout at the $0.000032 resistance level could lead the coin price towards the next resistance of $0.000040. Conversely, a breakout at the $0.000021 level could lead the price further down, towards the $0.000018 and 0.000015 levels.
There is a strong bullish view on the Shiba price rising over the next few years. By the end of 2021, it is estimated that it will be worth $0.0000428. Shiba is anticipated to reach a peak of $0.0000868 by the end of 2025, following a period of stable growth in 2022, 2023 and 2024.
Good luck!


