WTI Crude Oil Climbs 12% in 7 Days to $63.24 as US-China Tariff Truce Lifts Sentiment
WTI crude oil (USOIL) is trading at $63.24 after rising from the May low of $56.44, up 12% in a week...
Quick overview
- WTI crude oil is currently trading at $63.24, up 12% from a May low of $56.44, supported by a temporary pause in US-China trade tensions.
- A surprise increase of 4.3 million barrels in US crude inventories has traders concerned about potential weakening demand or rising supply.
- Technically, WTI crude remains in a bullish trend, with prices above key support levels and showing classic signs of an uptrend.
- Market participants are also monitoring President Trump's trip to Riyadh, which may influence oil price stability ahead of the summer travel season.
WTI crude oil (USOIL) is trading at $63.24 after rising from the May low of $56.44, up 12% in a week. The upmove is supported by a temporary de-escalation in US-China trade tensions. On Monday, both countries agreed to pause tariffs for 90 days: US reduced import duties from 145% to 30% and China dropped tariffs on US goods from 125% to 10%.
“The US-China economic pause might have created a narrative that could boost demand in a backdrop of cautious optimism,” said Priyanka Sachdeva, senior market analyst at Phillip Nova. But analysts warn that the bullishness could be tempered by short term supply side pressures.
Inventory Surge Capped Rally
Despite the bullish tone, traders are wary of a 4.3 million barrel surprise increase in US crude inventories as reported by API. This number if confirmed by EIA data could mean weakening demand or rising supply and put pressure on the recent upmove.
“This big contrast to last week’s big draw means the demand side is still struggling with big challenges,” Sachdeva added.
Market is also watching President Trump’s trip to Riyadh where he promised to lift sanctions on Syria and got a $600 billion Saudi investment package. Analysts believe this is to calm oil price volatility before the summer travel season.
WTI Crude Oil: Technicals Remain Bullish
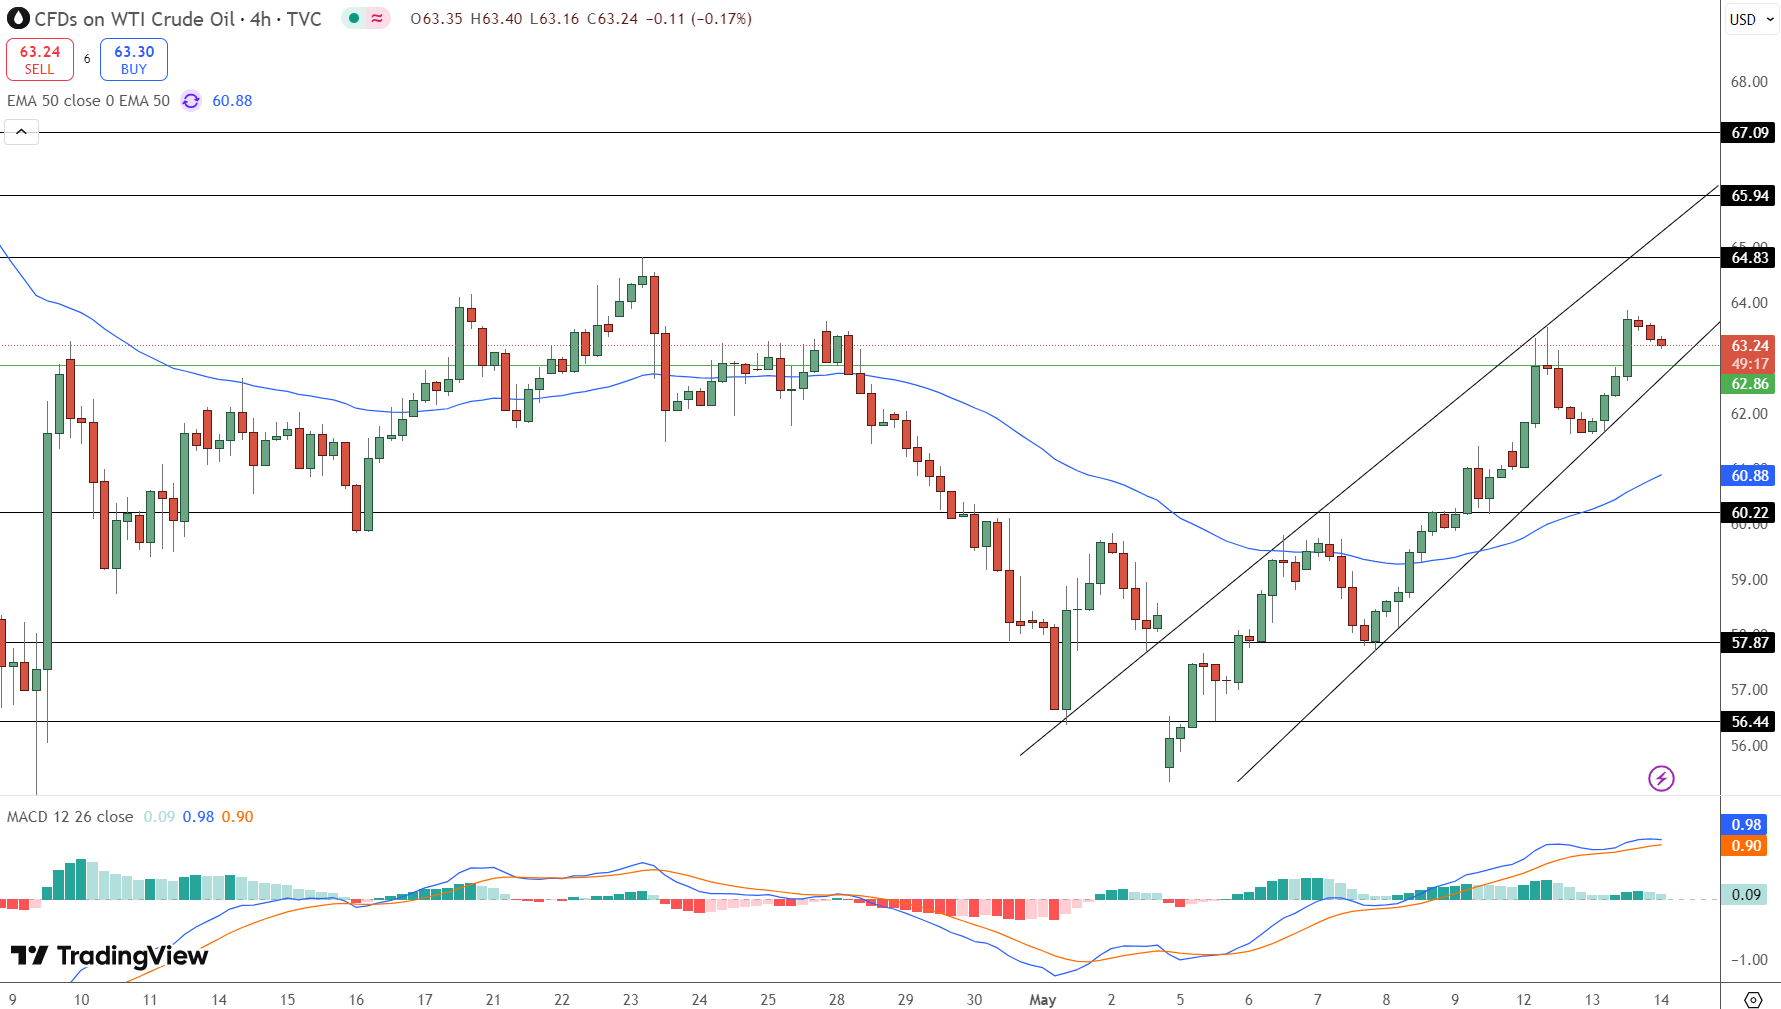
From a technical perspective, WTI crude is in a rising channel on 4 hour chart. Price is above 50 period EMA ($60.88) and making higher highs and higher lows – classic signs of an uptrend.
-
Support zones: $62.86 (channel base), $60.88 (EMA), $60.22 (swing low)
-
Resistance levels: $64.83 (swing high), $65.94 (psychological resistance), $67.09 (multi week high)
-
MACD: Still positive but histogram is showing early signs of slowing down
Trade Setup:
-
Entry: $62.90-$63.10 (on dip into support)
-
Target 1: $64.83
-
Target 2: $65.94
-
Stop loss: Below $62.10
As long as WTI is above trendline and EMA, it’s bullish. Below $60.88 and it’s bearish. Watch for MACD crossovers and high volume breakouts.
- Check out our free forex signals
- Follow the top economic events on FX Leaders economic calendar
- Trade better, discover more Forex Trading Strategies
- Open a FREE Trading Account
- Read our latest reviews on: Avatrade, Exness, HFM and XM
Related Articles
Sidebar rates
