WTI Crude Oil (USOIL) Eyes Recovery—$63.82 Level in Sight
Crude oil held its ground on Friday, poised for a second straight weekly gain. That's thanks in part to easing US-China trade tensions...
Quick overview
- Crude oil prices are stable, supported by easing US-China trade tensions and the potential for an Iranian nuclear deal.
- Analysts predict that a successful Iranian deal could add 400,000 barrels per day to global supply, increasing short-term supply pressure.
- The International Energy Agency has raised its 2025 global supply growth forecast while demand is expected to rise only marginally.
- WTI crude is facing technical resistance around $61.64, with a bearish outlook unless prices break above $61.65.
Crude oil held its ground on Friday, poised for a second straight weekly gain. That’s thanks in part to easing US-China trade tensions, which have helped cushion prices. But there’s still a bit of a wild card in play: the potential for an Iranian nuclear deal. President Trump said Tehran had “sort of” agreed to US terms—but negotiations remain up in the air.
Analysts at ING think a successful deal could bring around 400,000 barrels per day of Iranian crude back into global markets. That would increase short-term supply pressure. The International Energy Agency (IEA) raised its 2025 global supply growth forecast by 380,000 barrels per day.
But it also thinks demand will only rise by 20,000 barrels per day. That adds to expectations of a surplus heading into next year. Central bank rate cuts, which could boost economic activity and oil demand later this year, are still giving investors a reason to be optimistic.
WTI Crude Oil (USOIL) Technical Outlook: $60 Support Holds
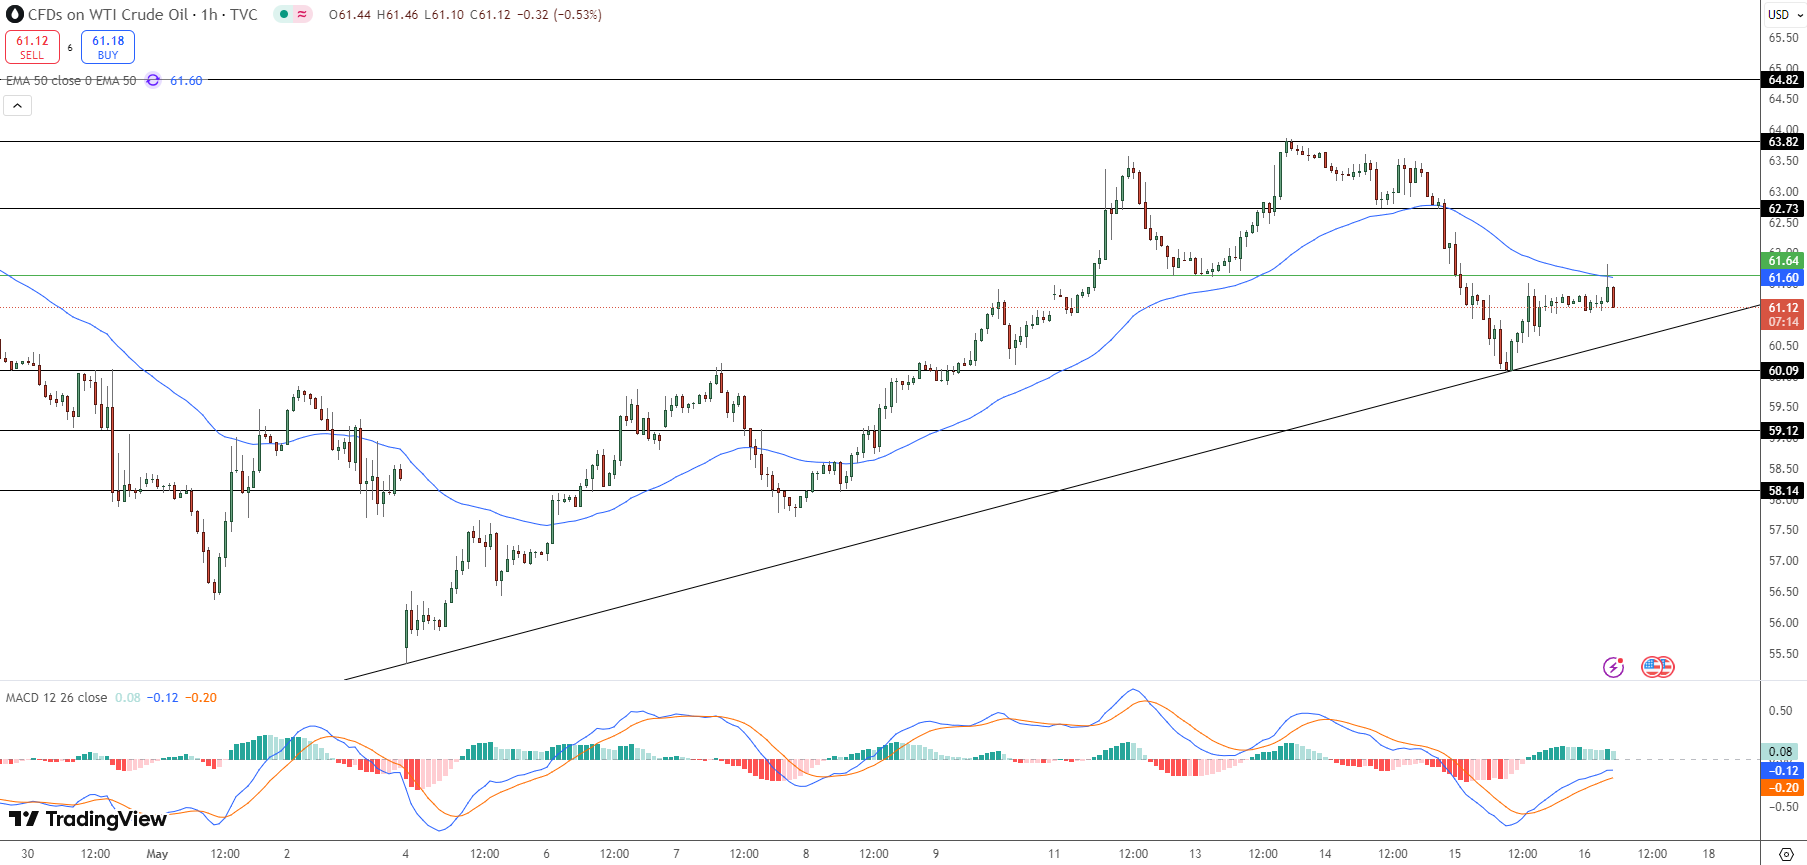
The technical outlook is a bit more bearish. WTI crude is respecting an ascending trendline that started in early May. But after rebounding from $60.09, the price tested but failed to hold above the 50-hour EMA at $61.60. That indecision—coupled with the lack of follow-through—is raising some downside risks.
WTI crude has immediate resistance at $61.64, $62.73 and $63.82. And support at $60.09 and $59.12. A spinning top candlestick near that resistance is a sign of indecision. A strong bullish engulfing candle above $61.65 would really shift the short-term bias to the upside.
Outlook: $68 Brent Average Seen in 2025
Analysts at BMI (Fitch Solutions) are still forecasting a 2025 average Brent price of $68 per barrel. That’s slightly below the 2024 average of $80. They see 2026 prices rising to $71, mainly due to ongoing uncertainty in global trade policy and elevated OPEC+ supply.
That 90-day trade truce between the US and China has eased recession fears and given oil a much-needed reprieve. Unless demand really starts to rebound and geopolitical risks intensify, oil’s upside may stay capped.
- Check out our free forex signals
- Follow the top economic events on FX Leaders economic calendar
- Trade better, discover more Forex Trading Strategies
- Open a FREE Trading Account
- Read our latest reviews on: Avatrade, Exness, HFM and XM
Related Articles
Sidebar rates
