PEPE Price Prediction: PEPE at $0.00001304—Will the Next Bounce Target $0.00001540?
PEPE is trading at $0.00001304, down 0.53% over the past 24 hours. With a market cap near meme coin highs and a loyal fanbase watching...
Quick overview
- PEPE is currently trading at $0.00001304, experiencing a slight decline of 0.53% in the last 24 hours.
- Key support is at $0.00001330, while resistance levels are identified at $0.00001395 and $0.00001540.
- The technical analysis indicates a bearish trend with a MACD crossover and indecision near support levels.
- Traders are advised to wait for a clear break above resistance or below support before making any moves.
PEPE is trading at $0.00001304, down 0.53% over the past 24 hours. With a market cap near meme coin highs and a loyal fanbase watching closely, all eyes are on whether PEPE can hold key levels and bounce to $0.00001540.
PEPE Key Support and Resistance
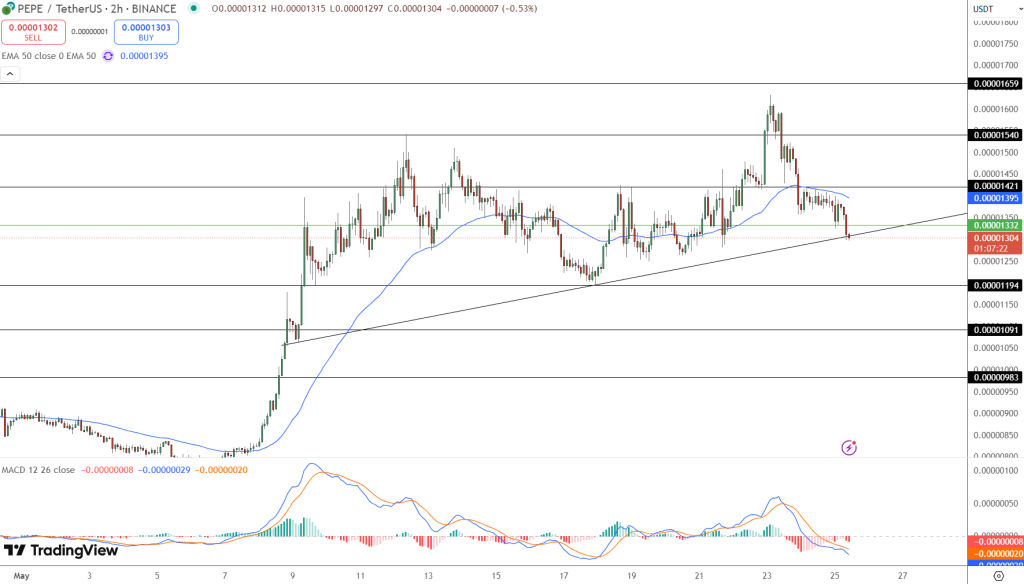
PEPE has dropped below its 50-period EMA ($0.00001395) on the 2-hour chart, putting pressure on short-term momentum. Price action is testing the ascending trendline near $0.00001330, a level that has been support during recent consolidations.
-
Immediate Support: $0.00001330, then $0.00001194 and $0.00001091.
-
Resistance Levels: $0.00001395, $0.00001421 and $0.00001540.
-
MACD Signal: Bearish crossover with widening histogram, down trend.
If PEPE holds $0.00001330, a bounce to $0.00001395 and then $0.00001421-$0.00001540 is possible. A clean break below $0.00001330 could be a deeper pullback to $0.00001194.
PEPE Technical Analysis: Cautious but Watchful
The break below the 50 EMA and trendline is bearish for short-term traders. Small candles near support indicate indecision, while the MACD is bearish.
For traders:
-
Bullish Scenario: Reclaim $0.00001395 and close above for $0.00001540.
-
Bearish Scenario: Break below $0.00001330 to $0.00001194 or $0.00001091.
-
Watch For: Bullish engulfing candles, narrowing MACD histogram or MACD crossover for reversal signals.
Meme Coin Sentiment and Market Dynamics
PEPE is one of the more volatile meme coins, with price action tied to market sentiment and broader crypto trends. The recent selloff is in line with thin liquidity and meme coin sector retracements, but whale movements and on-chain metrics can still spark big bounces.
Be patient. Wait for a clean break above resistance or below support before entering positions.
- Check out our free forex signals
- Follow the top economic events on FX Leaders economic calendar
- Trade better, discover more Forex Trading Strategies
- Open a FREE Trading Account
- Read our latest reviews on: Avatrade, Exness, HFM and XM
Related Articles


Sidebar rates
Related Posts
