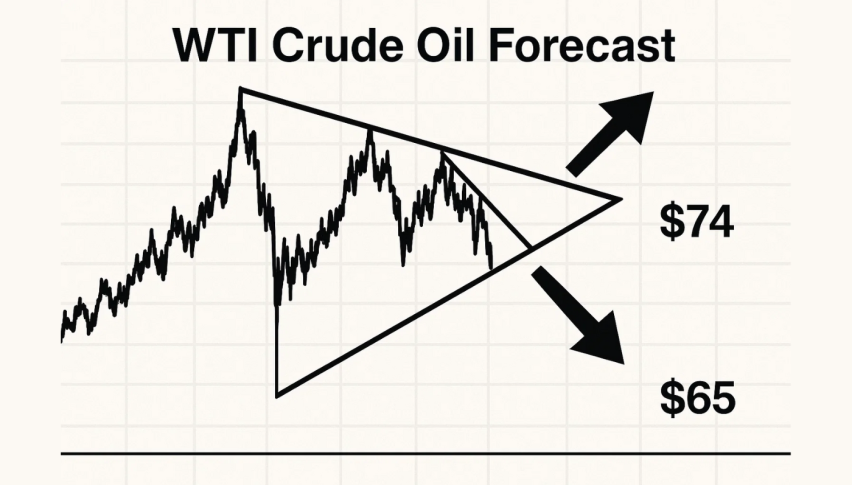
WTI Crude Oil Forecast: Triangle Pattern Signals $74 or $65 Move Amid Tensions
WTI crude futures rose to $72.10 earlier this week before backing off as global tensions escalate. A series of high profile military...
Quick overview
- WTI crude futures rose to $72.10 earlier this week but have since retreated to $69.81 amid escalating global tensions.
- The market is experiencing volatility due to military exchanges, comments from global leaders, and OPEC+ increasing output quotas.
- WTI is forming a symmetrical triangle pattern, indicating indecision with key resistance at $70.48 and support at $69.00.
- A breakout above $72.04 could target $74.63, while a breakdown below $69.00 may lead to further declines towards $67.83.
WTI crude futures rose to $72.10 earlier this week before backing off as global tensions escalate. A series of high profile military exchanges has oil markets on edge about supply disruptions along key energy corridors. Despite one side being open to de-escalation and new nuclear talks, oil is still volatile.
Monday’s trading was a perfect example of that. WTI swung $8 intraday before settling lower. The big moves were not just about conflict risk but also comments from global leaders and trade tariff speculation. And to top it off OPEC+ is increasing output quotas making supply demand expectations and price direction even more complicated.
Crude Oil Price Action in a Triangle
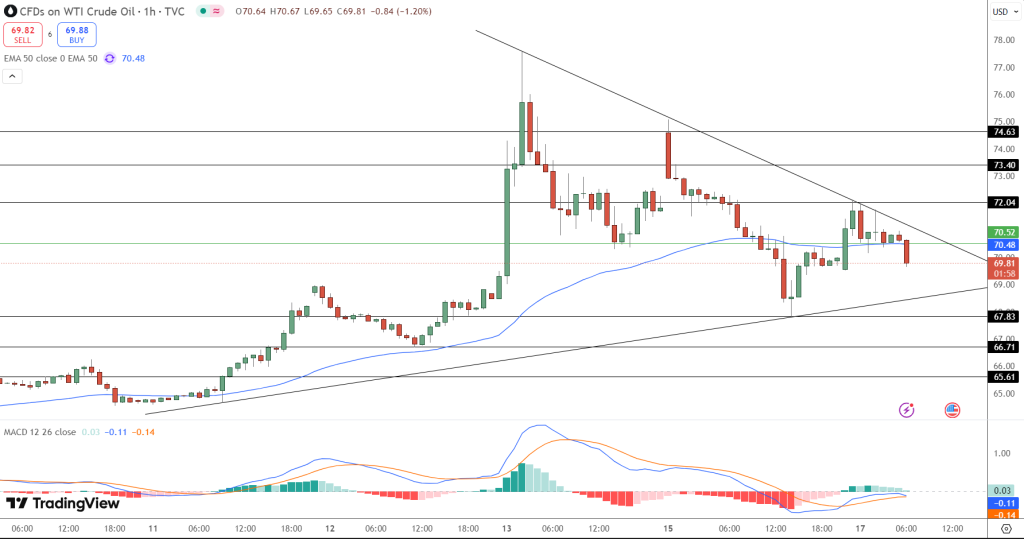
WTI is now at $69.81 down 1.2% on the week. Price is in a classic symmetrical triangle on the 1 hour chart and is ready to break out in either direction. The battle between lower highs and higher lows is a sign of indecision and a market waiting for its next big move.
The 50 period EMA at $70.48 is acting as a strong resistance. Recent candles are rejecting at this level and the MACD is flat with both lines hugging the zero line. Momentum has faded.
Key resistance levels to watch:
- $70.52 – immediate resistance at triangle top
- $72.04 – breakout zone
- $73.40 – previous supply zone
If price breaks and closes above $72.04 bulls may target $74.63.
Downside Risks Could Accelerate on Breakdown
Support is forming at $69.00 with trendline just below. If price fails to hold this support it could trigger a bigger move lower and bears will be looking at $67.83 and $66.71 as targets.
Also watch:
- MACD crossover confirmation
- Volume at trendline edges
- Price at triangle apex
Until a clear breakout happens WTI is in a consolidation. This coiling price action with macro uncertainty makes the next move potentially big and fast.
Key Points:
- WTI at $69.81 with geopolitical concerns and OPEC+ pressure
- Triangle pattern means $74 or $65 range next
- MACD flat; 50 period EMA at $70.48
- Check out our free forex signals
- Follow the top economic events on FX Leaders economic calendar
- Trade better, discover more Forex Trading Strategies
- Open a FREE Trading Account
- Read our latest reviews on: Avatrade, Exness, HFM and XM
Related Articles


Sidebar rates
Related Posts
