Bitcoin Holds Above $105K Amid Geopolitical Tensions: Technical Analysis Points to Potential 25% Rally
Bitcoin (BTC) is currently trading at $105,000. It has dropped 1.8% in the last 24 hours as traders are being careful because of important
Quick overview
- Bitcoin is currently trading at $105,000, having dropped 1.8% in the last 24 hours due to market caution ahead of the FOMC interest rate announcement.
- Mid-term holders are realizing significant profits, indicating a shift in market dynamics, while long-term holders remain stable and not distributing substantial amounts of Bitcoin.
- Technical analysis suggests Bitcoin is nearing a short-term bottom, with key support levels around $102,000 to $104,000, and a potential breakout if it surpasses $109,300.
- Despite geopolitical tensions, Bitcoin has historically shown resilience during conflicts, and there are optimistic predictions for a price increase to $130,000 by the end of Q2 if current resistance levels are broken.
Bitcoin BTC/USD is currently trading at $105,000. It has dropped 1.8% in the last 24 hours as traders are being careful because of important market events and ongoing tensions in the Middle East.
FOMC Decision and Market Sentiment Drive Near-Term Weakness
The cryptocurrency’s latest drop to $103,300 shows that people are being cautious ahead of Wednesday’s Federal Open Market Committee (FOMC) interest rate announcement. This correction comes after a bearish weekly candle finish, which could mean that the trend is about to change. The rising tensions between Israel and Iran also add to the overall risk-off mood in global markets.
Bitcoin Vector, a market pulse aggregator supported by Swissblock, says that the drop isn’t just because of the economy; it’s also because of seasonal weakness and a slowdown in on-chain network expansion, which means that spot demand is cooling. The selloff is very leveraged, as shown by the fact that $434 million worth of BTC futures were sold in the last 24 hours. This shows that traders are cutting back on their exposure instead of starting new positions.
Even though this is a cautious approach, the Bitcoin Coinbase Premium Index has stayed positive for most of June, which shows that US investors are still interested in buying Bitcoin. But this demand hasn’t had a big effect on prices because the market is still quite unsettled.
On-Chain Analysis Reveals Strategic Profit-Taking by Mid-Term Holders
According to Glassnode data, “mid-cycle holders” (those who have held for 6 to 12 months) are making a lot of money. On Monday alone, they made $904 million. This group made up 83% of all realized gains, which is a big change from longer-term holders who used to be the ones that took profits the most.
This rotation indicates a shift in market dynamics, with more reactive traders taking advantage of recent highs. But long-term investors are still doing well. Axel Adler Jr., a Bitcoin researcher, says that long-term holders (LTHs) are still not distributing substantial amounts of Bitcoin, which is a sign of a positive market.
The robust MVRV Z-score shows that Bitcoin is still fundamentally undervalued. The positive Coin Days Destroyed (CDD) momentum, on the other hand, demonstrates that people are collecting profits instead of panicking and selling. In the past, setups like this have led to rallies of 18–25% in 6–8 weeks, which means that the price might reach $130,000 by the end of Q2.
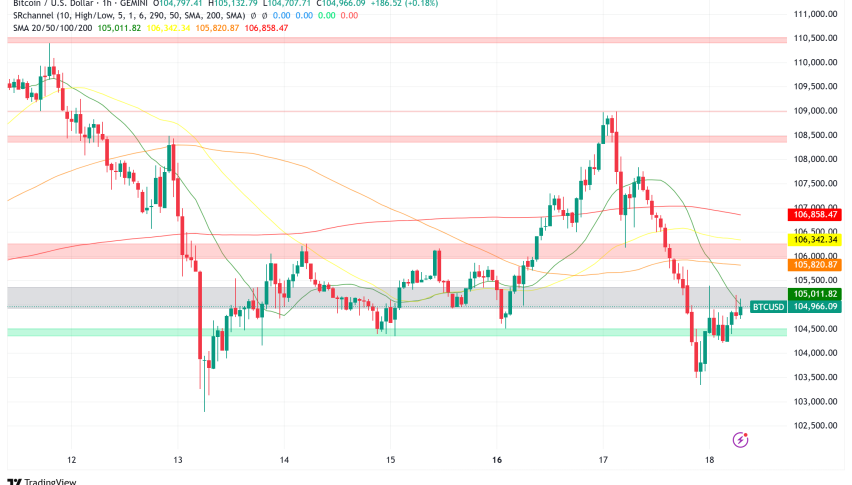
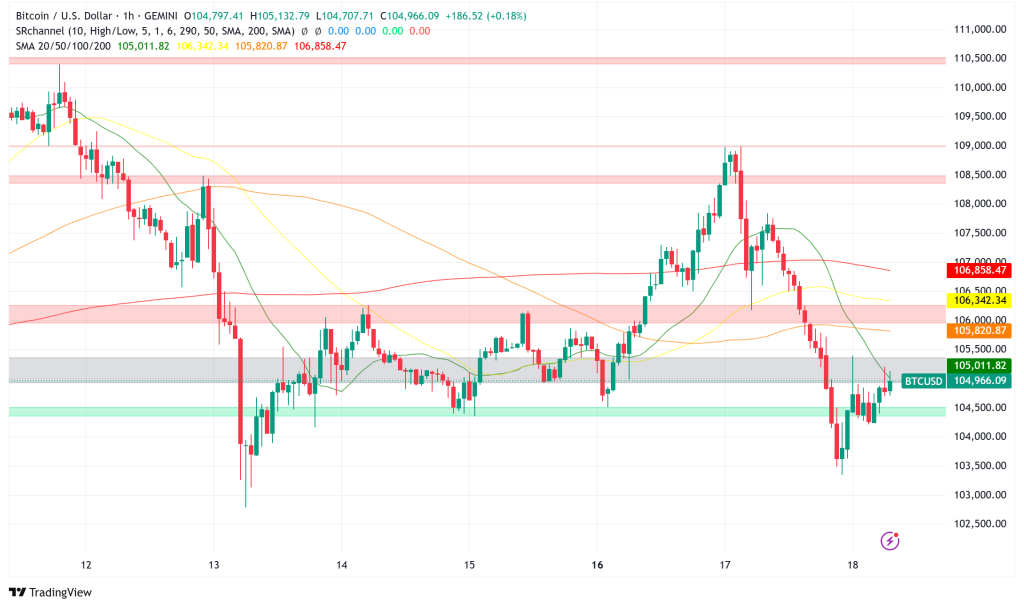
BTC/USD Technical Analysis: Support Levels and Breakout Potential
From a technical point of view, Bitcoin seems to be getting close to a short-term bottom between $102,000 and $104,000, where there are a lot of order blocks and dense liquidity pockets. The Bollinger Bands analysis backs this up, with the middle band around $106,000 acting as a moving barrier.
The bands are getting closer together, which means that a surge in volatility is about to happen. If the price goes back up and closes over $106,748, it could suggest that a positive mean reversion toward $112,000 is possible. On the other hand, a clear break below $100,000 could mean that the bullish setup is no longer applicable and that the target is $98,000.
Alphractal’s data shows that $98,300 is an important level of support where short-term holders can still make money. The company says, “As long as Bitcoin stays above the STH Realized Price, we can still think of the market as bullish.” If BTC loses the $98K mark quickly, the situation will only change. This might cause a bigger plunge.
Weekly Resistance Weakening: Signs of Potential Breakout
Rekt Capital, a technical analyst, says that Bitcoin’s last big weekly resistance level, which has stopped price advances in the past, may be losing its strength as a rejection point. This change in structure could be a key turning point, possibly leading to price discovery above where it is now.
The 12-hour chart shows that Bitcoin is staying in a tight range, staying above the important $103,600 support level and challenging the $109,300 resistance level. The 100-day SMA is providing support that changes over time, while the 50-day SMA is showing early signs of positive momentum. BTC has to break past the $109,300 resistance level with steady volume for bulls to get complete control again.
Geopolitical Resilience: Bitcoin’s Historical Performance During Conflicts
A look at history shows that Bitcoin has been very strong during international crises. The present war between Israel and Iran, which got much worse on June 13 when Israel hit many Iranian targets, caused the market to be unstable for a short time. But Bitcoin has mostly bounced back, and crypto expert Za said, “Bitcoin doesn’t seem to care about the conflict between Israel and Iran (yet).”
This strength is similar to how Bitcoin did in other conflicts, like the 2022 Russia-Ukraine invasion, when BTC rose 16% in just five days, and the 2023 Israel-Gaza conflict, when the cryptocurrency stayed mostly stable and was worth much more than it was worth before the attacks 50 days later.
The pattern shows that Bitcoin may be volatile in the short term when a conflict starts, but it usually bounces back as markets adjust to new geopolitical circumstances. Even if tensions are high right now, Michael Saylor’s MicroStrategy showed faith in this resilience by buying 10,001 BTC for $1 billion on June 16.
Bitcoin Price Prediction: Cautious Optimism Amid Multiple Variables
Even though there are some problems in the short term, there are many reasons to be optimistic about Bitcoin. The combination of strong technical support levels, good on-chain indicators, institutional confidence, and past geopolitical resilience makes it possible for prices to go up.
If Bitcoin’s price follows historical patterns and breaks through present resistance levels, it might rise by 25%, as cyclical research suggests, and possibly reach $130,000 by the end of Q2. If, on the other hand, important support levels aren’t held, especially the $98,300 level, deeper corrections could happen.
People who trade in the market should keep an eye on the FOMC’s decision, changes in the world, and Bitcoin’s ability to get back above $106,748 and stay there as important factors that could cause the next big price change.
- Check out our free forex signals
- Follow the top economic events on FX Leaders economic calendar
- Trade better, discover more Forex Trading Strategies
- Open a FREE Trading Account
- Read our latest reviews on: Avatrade, Exness, HFM and XM
Related Articles


Sidebar rates
Related Posts
