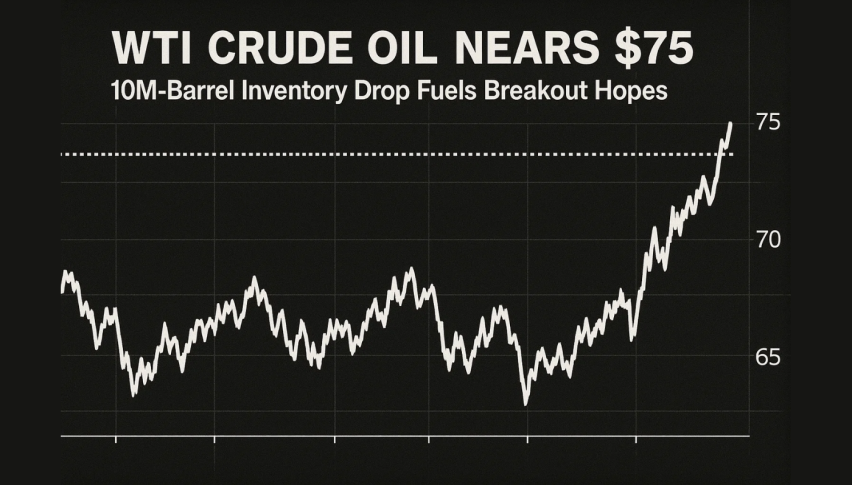
WTI Crude Oil Nears $75 as 10M-Barrel Inventory Drop Fuels Breakout Hopes
Oil prices fell on Wednesday as investors wait for the US Federal Reserve decision that will shape demand expectations.
Quick overview
- Oil prices fell on Wednesday as investors await the US Federal Reserve's decision on interest rates.
- Brent crude dropped 0.5% to $76.09, while WTI crude slipped 0.3% to $74.61 amid mixed geopolitical signals.
- Analysts expect the Fed to maintain rates, but global growth concerns and Middle East tensions complicate the outlook.
- WTI crude is consolidating in a symmetrical triangle pattern, with key support at $72.60 and resistance at $74.62.
Oil prices fell on Wednesday as investors wait for the US Federal Reserve decision that will shape demand expectations. Brent crude dropped 0.5% to $76.09, while WTI crude slipped 0.3% to $74.61, giving back earlier gains as mixed geopolitical and macro signals emerged.
Most analysts expect the Fed to keep rates steady between 4.25% and 4.50%, but weakening global growth and Middle East tensions are clouding the outlook. On one hand, supply concerns driven by conflict could push prices higher—raising inflation risks and preventing the Fed from cutting rates. On the other, slowing demand could make the case for a rate cut sooner than expected.
Oil is walking a tightrope as worries over potential disruptions in the Strait of Hormuz, which carries about 20% of global seaborne oil, add to the mix. Fitch says “a material disruption to Iran’s exports would fuel price spikes”, but OPEC+ could offset any shortage with spare capacity.
WTI Technical Setup: Triangle Pattern Tightens
WTI crude (USOIL) is trading at $73.10, consolidating in a symmetrical triangle on the 2-hour chart. Price is compressing between rising support at $72.60 and descending resistance at $74.62.
- Support levels: $72.60, $70.90, $69.56
- Resistance levels: $74.62, $75.97, $77.53
- 50-EMA: $70.96, acting as support
- MACD: Neutral, with converging signal lines and flat histogram
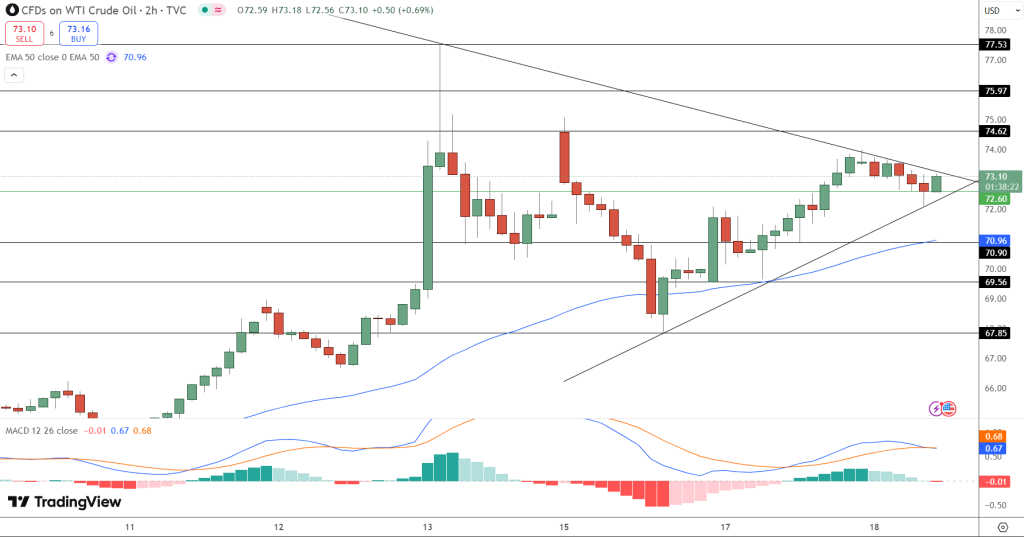
A breakout above $74.62 could take price to $77.50, while a break below $72.60 would target $70.90 and below.
Macro and Technical Drivers Mean Volatility
With the Fed decision, geopolitics and narrowing ranges, oil is ready to move. Until the breakout happens, watch for volume surges and MACD signals as confirmation. A sustained move above resistance could be bullish if safe-haven flows increase on conflict escalation.Until then.
- Check out our free forex signals
- Follow the top economic events on FX Leaders economic calendar
- Trade better, discover more Forex Trading Strategies
- Open a FREE Trading Account
- Read our latest reviews on: Avatrade, Exness, HFM and XM
Related Articles


Sidebar rates
Related Posts
