Bitcoin Faces Critical Technical Crossroads Above $101,000 as Geopolitical Tensions Mount
Bitcoin (BTC) is at a very important point. It is trading above $101,000, but it has dropped more than 1% in the last 24 hours because of a
Quick overview
- Bitcoin is currently trading above $101,000 but has dropped over 1% in the last 24 hours due to geopolitical tensions and technical resistance.
- Recent U.S. military actions in Iran have contributed to market volatility, although historical trends suggest geopolitical turmoil can sometimes benefit Bitcoin.
- Institutional adoption of Bitcoin is increasing, with Texas establishing a special Bitcoin reserve and companies like Nakamoto Holdings raising significant capital for Bitcoin purchases.
- Technical analysis indicates critical support and resistance levels for Bitcoin, with potential scenarios ranging from a pullback below $96,000 to a rise towards $144,000.
Bitcoin BTC/USD is at a very important point. It is trading above $101,000, but it has dropped more than 1% in the last 24 hours because of a number of technical and geopolitical variables that are making the market very complicated. The biggest cryptocurrency in the world is going through a lot of uncertainty right now because of recent U.S. military activities in Iran. At the same time, it is facing important technical resistance levels that could affect its short-term path.
Geopolitical Catalyst Triggers Market Volatility
After President Donald Trump said that airstrikes on Iranian nuclear facilities had been effective, the cryptocurrency market became quite unstable right after. This was meant to lower tensions in the Middle East. Bitcoin’s price dropped quickly, going below $102,000 as investors thought about what it meant for the U.S. to get directly involved in the Israel-Iran confrontation.
But history shows that geopolitical turmoil may end up being good for Bitcoin. Market analysts refer to April 2022, when the price of BTC went up 42% in 35 days after the Ukraine conflict started, even if the market was generally going down. Bitcoin is now trading above $100,000 in a strong bull market. Some traders think that news of conflict could give the market a new boost.
Institutional Adoption Continues Despite Volatility
Even though there are still some technical questions, more and more institutions are starting to use Bitcoin. Senate Bill 21 makes Texas the first U.S. state to set up a special Bitcoin reserve. The state will manage the fund and keep Bitcoin as a long-term strategic asset. The reserve works on its own, separate from the state’s normal treasury. It can increase through airdrops, gifts, and investment gains.
Corporate adoption is still going strong. For example, Nakamoto Holdings raised $51.5 million in new capital to buy more Bitcoin, while The Blockchain Group added 182 BTC worth $19.6 million to its treasury reserves.
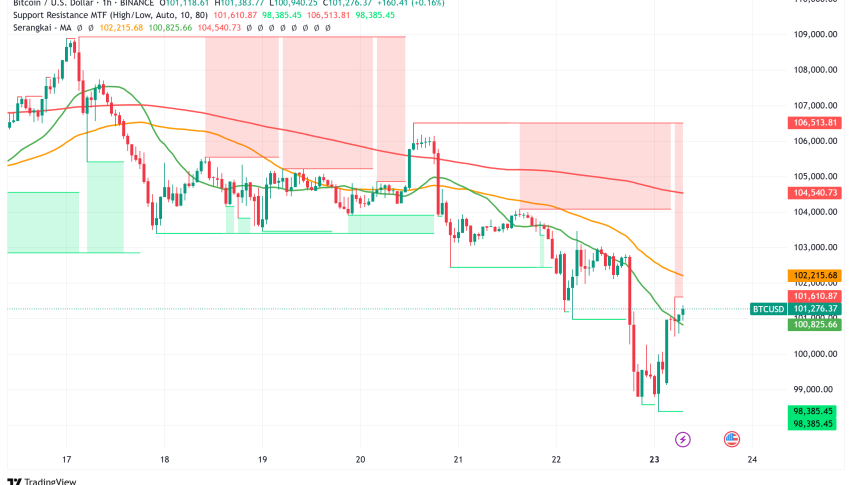
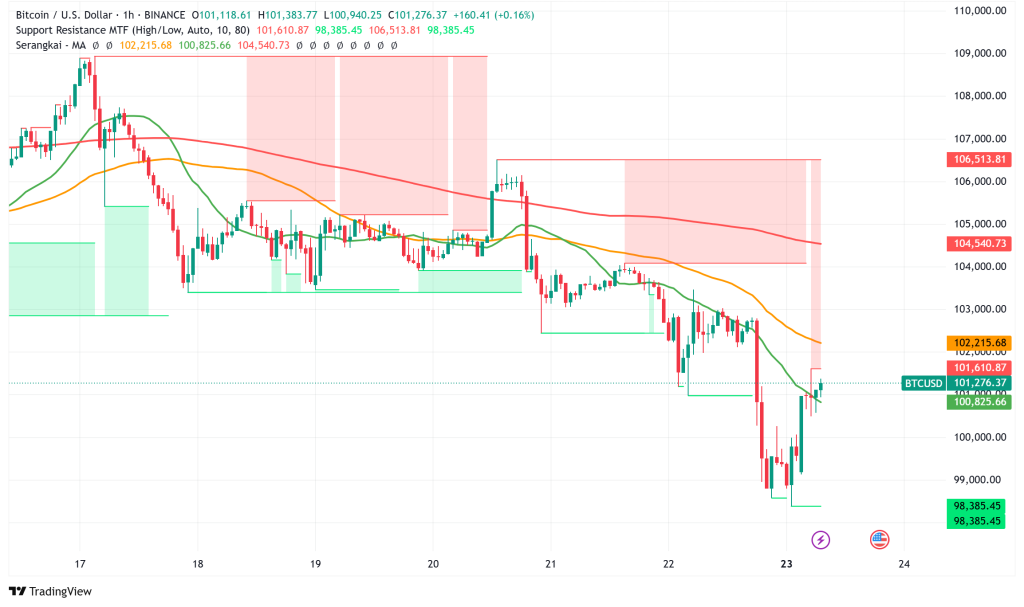
BTC/USD Technical Analysis Reveals Critical Support and Resistance Levels
The Mayer Multiple is a complex on-chain indicator that looks at how Bitcoin compares to its 200-day moving average. It gives useful information about possible price objectives. On-Chain College, an expert, says that since the current bull market started in Q4 2024, Bitcoin has always traded between the 1.0x band ($96,000) and the 1.5x band ($144,000).
The analysis shows that Bitcoin has only ever reached cycle peaks after hitting the 2.5x band. This means that there is still a lot of space for growth in the current market cycle. This technical framework outlines two principal scenarios: a possible pullback below $96,000, which may eliminate weak hands prior to a bullish turnaround, or an ascent towards $144,000, consistent with the established range-bound action.
Bearish Signals Emerge as Key Moving Average Breaks
Scott Melker, an analyst, says that Bitcoin falling below its 50-day moving average on the daily chart is a worrying sign. This technical breakdown last happened in early February, when Bitcoin was worth about $84,000. This started a sustained downturn that brought the price down to $74,000 by April, a drop of almost 26%.
The 50-day moving average is an important trend indicator. Prices above this level usually mean that the market is going up, while prices below this level usually mean that the market is going down. The current fall below this psychological support level makes bearish sentiment stronger and makes it more likely that there will be another big decline, possibly to the $76,200 level.
Bitcoin Price Predictions Paint Mixed Outlook
People in the market still have very different opinions on where Bitcoin is going right now. CoinCodex is neutral, although it does see a big breakout to $136,472 in five days, with longer-term forecasts of $138,379 in three months and $116,115 in six months.
Ali Martinez, a well-known expert, says that if the present support level of $102,000 is broken, the price could drop to $82,000, based on MVRV pricing bands. According to exchange order book data, the first big support level is around $97,000. This is where a lot of liquidity could help prices stay stable.
Market Outlook: Navigating Uncertainty
Bitcoin’s price is already above $101,000, which is a key turning point where technical analysis, geopolitical events, and patterns in institutional adoption all come together. The cryptocurrency has to deal with two problems: it needs to stay above critical psychological levels of support, and it might profit from traditional market hedging behavior during times of geopolitical instability.
Traders and investors should keep a close eye on the $100,000 support level. If the price stays below this level for a long time, it could confirm pessimistic predictions that the price will drop to $96,000 or below. On the other hand, if current levels hold up despite more institutional adoption, it might lead to another attack on the $110,000 resistance level and possibly much higher goals in the months to come.
- Check out our free forex signals
- Follow the top economic events on FX Leaders economic calendar
- Trade better, discover more Forex Trading Strategies
- Open a FREE Trading Account
- Read our latest reviews on: Avatrade, Exness, HFM and XM
Related Articles

Sidebar rates
Related Posts
