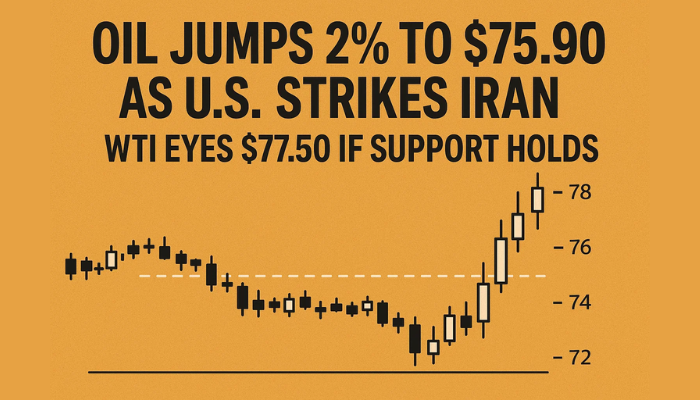
Oil Jumps 2% to $75.90 as U.S. Strikes Iran—WTI Eyes $77.50 if Support Holds
On Monday, the WTI crude oil climbed over 2%, testing $75.90 per barrel, their highest level since January. The move came after...
Quick overview
- WTI crude oil rose over 2% to $75.90 per barrel, the highest since January, following U.S. airstrikes on Iranian nuclear facilities.
- Traders are concerned about potential Iranian retaliation that could disrupt global oil flows, particularly through the Strait of Hormuz.
- Despite a slight pullback, the bullish trend remains intact, with key support levels around $74.13 and $73.18.
- Geopolitical tensions are expected to drive oil prices more than technical indicators in the near future.
On Monday, the WTI crude oil climbed over 2%, testing $75.90 per barrel, their highest level since January. The move came after the U.S. launched airstrikes on three Iranian nuclear facilities over the weekend, intensifying geopolitical tension in the world’s most sensitive oil corridor.
Traders are increasingly pricing in the risk that Iran may retaliate by disrupting global oil flows. Iran’s parliament voted to consider closing the Strait of Hormuz, a chokepoint that carries nearly 20% of global crude supply.
While the final decision rests with the Supreme National Security Council and Supreme Leader Ali Khamenei, even the prospect of closure has rattled energy markets.
The possibility of military escalation in a region that holds more than half the world’s proven oil reserves has added a significant geopolitical premium to oil prices, which could rise further if supply risks intensify.
Price Action Cools, But Uptrend Still Intact
Technically, crude oil pulled back slightly after rejecting at $76.11, a key resistance level that capped price action late last week. At the time of writing, WTI is trading around $74.64, down 0.82% on the day, as profit-taking set in.
Still, the chart structure remains bullish. An ascending trendline extending from the June 14 low intersects the price around $74.13–$73.18, creating a confluence zone with the 50-period EMA—a widely watched dynamic support level. If buyers defend this zone, momentum could reaccelerate toward $77.54 and $79.02.
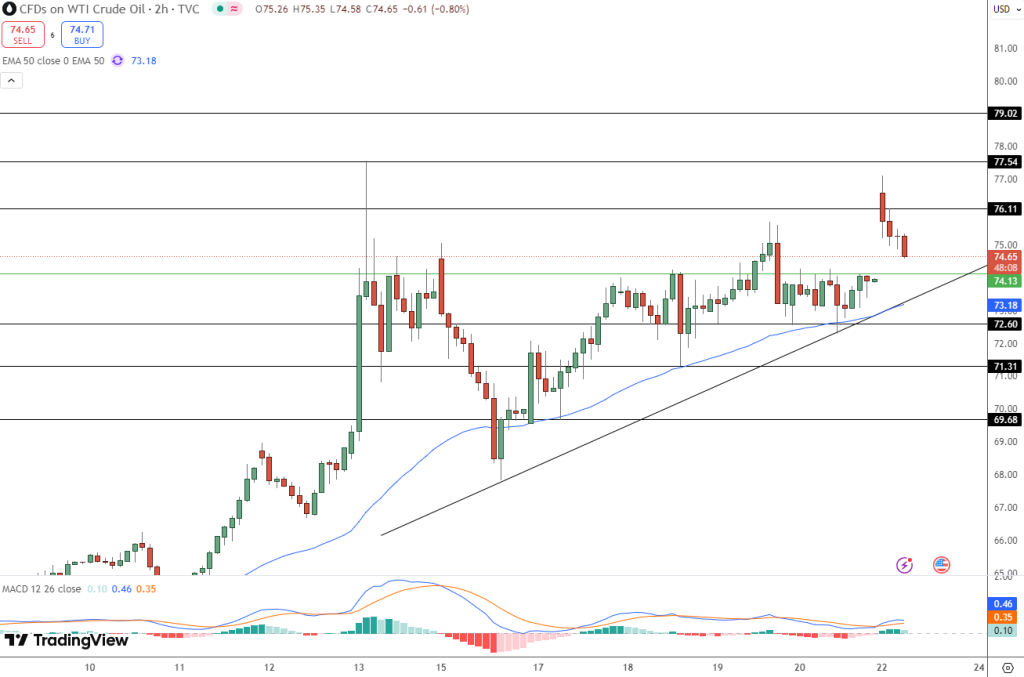
However, short-term indicators are flashing caution. The MACD histogram has flattened, and the MACD line is nearing a bearish crossover, suggesting fading bullish momentum. A decisive break below $73.18 could flip sentiment and trigger a retreat toward $72.60 or even $71.31.
Key Technical Levels to Monitor
Resistance:
- $76.11 – Immediate resistance
- $77.54 – Mid-March swing high
- $79.02 – Year-to-date top
Support:
- $74.13 – Trendline support
- $73.18 – 50-period EMA
- $72.60 – Previous breakout level
- $71.31 – Structural support
As long as price is above the trendline and 50 EMA, the bias is bullish. But the narrative will be driven more by geopolitics than technicals.
Conclusion:
With Middle East tensions hot and oil transport routes at risk, WTI crude’s next move is dependent on both chart and diplomacy. A bounce from here could take price to $77+, but a break would mean cooling off in a hot market.
- Check out our free forex signals
- Follow the top economic events on FX Leaders economic calendar
- Trade better, discover more Forex Trading Strategies
- Open a FREE Trading Account
- Read our latest reviews on: Avatrade, Exness, HFM and XM
Related Articles


Sidebar rates
Related Posts
