Solana (SOL) Faces Critical Support Test at $149: ETF Rally Fades and Technical Indicators Flash Warning Signs
Solana (SOL) is now at $149.33, a drop of 1.18% in the last 24 hours. Solana's price is at a crucial point as its recent ETF-driven rally
Quick overview
- Solana's price has dropped to $149.33, reflecting a 1.18% decline in the last 24 hours as the ETF-driven momentum fades.
- Analysts warn that SOL could fall by 20% if it fails to maintain support above critical levels, particularly the $144-$147 range.
- The technical outlook remains bearish, with SOL struggling to stay above key moving averages and facing potential targets as low as $95-$124.
- The next few days are crucial for SOL's direction, as it must hold above $144 to avoid further declines.
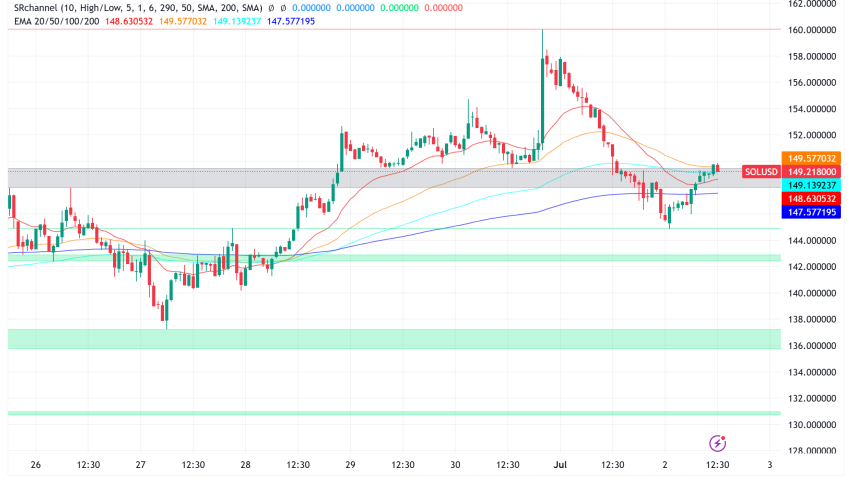
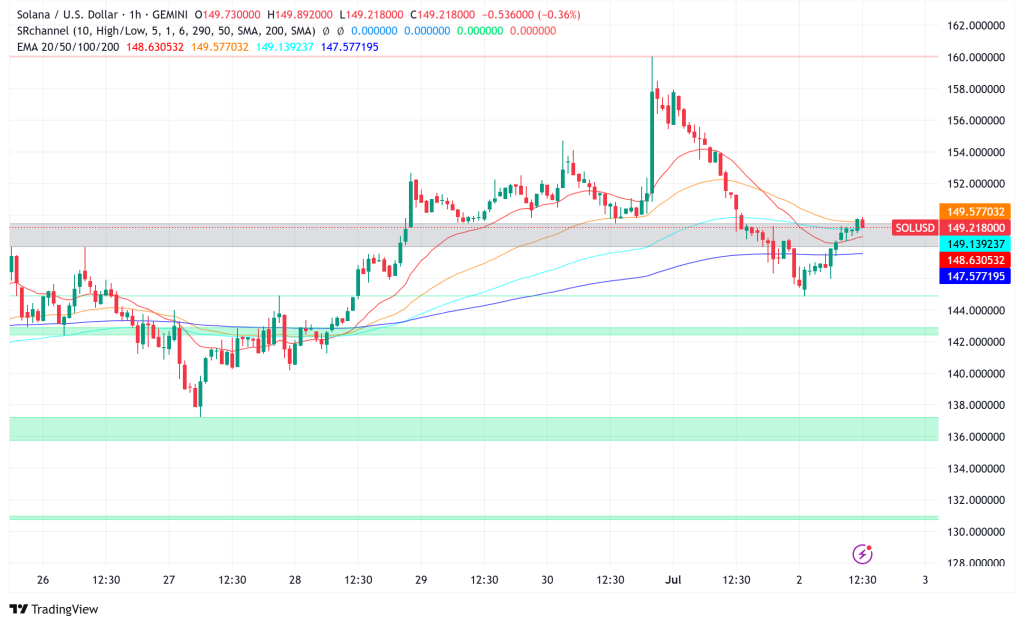
Solana SOL/USD is now at $149.33, a drop of 1.18% in the last 24 hours. Solana’s price is at a crucial point as its recent exchange-traded fund (ETF) driven boom came to an end. Analysts are warning that the altcoin might go down even more because it hasn’t been able to keep its momentum above important technical levels. Some think it could drop by as much as 20% if present support zones don’t hold.
The current price movement is bad news for SOL bulls. with rising 5% to $160 on Monday with news that Solana’s first ETF was going online for trading, the momentum didn’t last long, and the altcoin lost all of its gains in just 24 hours. This quick change has shown that there are still technical problems over a range of timeframes, which makes people wonder how long any recovery attempts will last.
SOL/USD Technical Analysis: Bearish Momentum Across Multiple Timeframes
The technical picture for SOL is still bad on the lower timescales. The cryptocurrency hasn’t been able to stay above the 50-day and 200-day exponential moving averages (EMAs) for more than a month, even though there have been a number of clear bullish break-of-structure developments. Last week’s gain above $148 was the most important thing that didn’t turn into a lasting rally, which shows how weak the market structure really is.
The immediate technical view shows that the $148 level is still under a lot of pressure. If SOL falls below $137, it would confirm a lower low formation, which would make it impossible for the market to continue going up in the near future. Analysts say that for the altcoin to get back on track, it needs to successfully retest the $145-$137 demand zone and then rise beyond $160. This would change the mood of the market.
Higher Timeframe Analysis Points to Potential $95-$124 Target Zone
The bigger picture analysis makes things look even worse for Solana holders. In May, SOL couldn’t break through the important resistance level of $180 on the daily chart. Since then, it has been moving down in a descending channel pattern. These kinds of patterns can sometimes lead to bullish breakouts, but SOL has been very sensitive to Bitcoin’s decline over the past month.
Solana’s relative underperformance compared to Bitcoin may be the most warning sign. Bitcoin is close to its all-time high of $106,956, but SOL has down almost 50% since January 19. This shows that the altcoin market is quite weak at now.
Technical analysts say that if the current negative trend continues, it is still possible to test the daily order block between $120 and $95 again. Investors might find this zone to be a better long-term entry opportunity, but they would have to deal with a lot more downside from where things are now.
UTXO Data Reveals Critical Support Concentration at $144-$147 Range
On-chain analysis gives us more information on SOL’s current situation. The UTXO realized price distribution (URPD) shows that 14.3% of SOL’s supply is in the $144.5 to $147.7 range. This is the price range at which tokens were bought. This is a very important support cluster that could either hold the current price steady or, if it breaks, cause more selling pressure to build up.
According to Glassnode, it’s important to stay above $144 to keep the correction from getting worse. If the price goes below this level, it could mean that the market is weak and that lower support zones are more likely to be tested again. The worrying thing about the current situation is that support is getting weaker at lower levels. Only 1.58% of supply is supporting the $124 level, and only 3% is concentrated in the $97-$100 region.
Solana Outlook: Bearish Bias with Key Levels to Watch
SOL looks like it could go down even further in the near future based on the current technical situation and on-chain statistics. The first targets for the downside are:
- First support: $142-$145 zone (current critical level)
- Secondary support: $124 (limited supply backing)
- Major support: $95-$100 range (thin support, high volatility risk)
For any bullish reversal scenario, SOL would need to:
- Hold above the critical $144 support level
- Reclaim and hold above $150-$152 resistance
- Achieve a strong daily close above $160 to flip sentiment
The resistance structure suggests that 5.55% of the supply is concentrated at $157, which could make it hard for any recovery attempt.
Solana Price Prediction: Critical Week Ahead for SOL’s Direction
The next few days will be very important for figuring out SOL’s medium-term orientation. The cryptocurrency is in a tough spot right now because the ETF-driven surge has entirely faded and technical indicators show bearish momentum across all timeframes. The current level of supply suggests that SOL could either have a big bounce from the $144-$147 cluster or break down below this zone. This might decide whether SOL has a relief rally or keeps going down toward the $95-$124 target region.
- Check out our free forex signals
- Follow the top economic events on FX Leaders economic calendar
- Trade better, discover more Forex Trading Strategies
- Open a FREE Trading Account
- Read our latest reviews on: Avatrade, Exness, HFM and XM
Related Articles

Sidebar rates
Related Posts
