Bitcoin Maintains $114K Support, Analysts Eye $148K-$189K Upside Targets
Bitcoin (BTC) is still above the $114,000 barrier, which is crucial for the mind. It has gone up 1.1% in the last 24 hours, even though it
Quick overview
- Bitcoin remains above the critical $114,000 level, having increased by 1.1% in the last 24 hours despite a 7.5% drop over the past three weeks.
- Technical analysis indicates a bullish reversal pattern, with the 50-day EMA providing strong support and a potential target of $148,250 based on an inverted head-and-shoulders pattern.
- On-chain data shows profit-taking by whales, suggesting market maturation, while long-term holders exhibit strong conviction amid current price fluctuations.
- Macro factors, including increased Federal Reserve liquidity and significant spot volume on exchanges, support a bullish outlook for Bitcoin's price in the coming months.
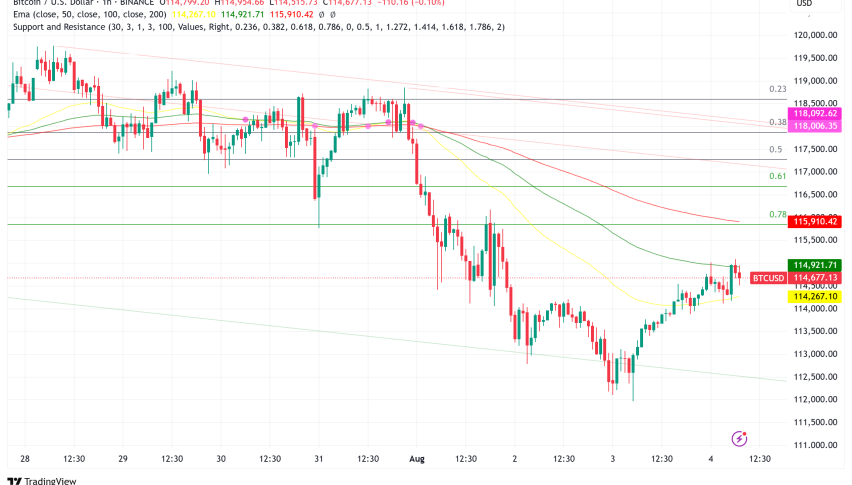
Bitcoin BTC/USD is still above the $114,000 barrier, which is crucial for the mind. It has gone up 1.1% in the last 24 hours, even though it has dropped 7.5% in the last three weeks from its all-time high of about $123,250. More and more, market watchers see this retreat as a healthy consolidation that might come before another big rally that takes prices to new all-time highs.

BTC/USD Technical Analysis Points to Bullish Reversal Pattern
50-Day EMA Provides Critical Support
It’s a big deal that Bitcoin has been able to go back to its 50-day exponential moving average (EMA) as support. BTC fell below this important level for a short time, but it has since rallied back, much like it did in June when it triggered a 25% surge.
BitBull, an analyst, says that even a possible decline into the $110,000-$112,000 level would create a “perfect bottom” for Bitcoin, which might lead to the next leg up. In the past, this technical setup has been a good place for new rallies to start.
Inverted Head-and-Shoulders Pattern Targets $148K
The present price movement fits with a larger inverted head-and-shoulders (IH&S) pattern, and the 50-day EMA lines up with the neckline of that pattern. This bullish reversal setup is more likely to be true now that Bitcoin has successfully retested this neckline after breaking above it.
The IH&S pattern suggests a technical target of about $148,250, which is very close to the $150,000 BTC price target that many analysts expect to see around October 2025.
Bitcoin’s On-Chain Data Reveals Cyclical Cooling Phase
Whale Profit-Taking Signals Market Maturation
CryptoQuant’s on-chain study shows that whales have taken profits from Bitcoin three times during the current bull market cycle, which runs from 2023 to 2025. The most recent wave saw an 80,000 BTC selloff worth about $9.6 billion when Bitcoin broke beyond the $120,000 mark.
Historical trends reveal that these profit-taking stages usually last two to four months and always lead to more accumulation and then breakouts to new all-time highs. CryptoQuant experts say that “the market is going through another cyclical cooling phase, which is normal for waves that came before periods of consolidation and then breakouts to higher prices.”
Long-Term Holders Show Strong Conviction
Recent information from Glassnode shows that short-term holders (STHs) are responsible for most of the market activity right now. In the last 24 hours, they spent $18 billion worth of Bitcoin, which is 86% of the total. On the other hand, long-term holders (LTHs) only made up 14.5% of the expended volume, which was $3.1 billion.
This distribution shows that veteran Bitcoin holders are very sure of themselves, since they usually see price drops as chances to buy more rather than sell.
Macro Factors Support Bullish Outlook
Federal Reserve Liquidity Surge Provides Tailwinds
The US Federal Reserve’s net liquidity rose from $6 trillion to $6.17 trillion on Friday, which is a sign that the macroeconomic environment is getting better for Bitcoin. Historically, this spike in liquidity has been linked to bullish moves in risk assets, such as cryptocurrency.
Also, Binance saw daily BTC spot volume of more than $7.6 billion, which is one of the biggest rises in the past few weeks. When looking at the past, it seems that spot volume spikes of this size generally happen near local bottoms or when prices change direction.
Long-Term BTC Price Projections Remain Ambitious
Power Law Model Suggests Sustainable Growth
A Power Law trend model that shows smooth, logarithmic rise over time fits with the present price of Bitcoin. The cryptocurrency is currently trading over its predicted growth line, but it is still well below the “red zone,” which usually means the market is getting too hot.
This posture offers a lot of space for growth before things get too bubble-like. Analysts say that BTC is about $50,000 behind its most recent peak.
Total Addressable Market Analysis Points to $189K
Digital asset company CoinShares did a full Total Addressable Market (TAM) research and found that Bitcoin may reach $189,000 if it gets just 2% of the world’s M2 money supply ($127 trillion) and 5% of gold’s market value ($24 trillion). This may mean a 65% rise from where we are now.
Bitcoin Price Outlook: Consolidation Before Continuation
The combination of technical, on-chain, and macroeconomic factors points to the idea that Bitcoin may be in the last stages of a healthy correction before it starts to rise again. The fact that the 50-day EMA support held up and the inverted head-and-shoulders pattern completed gives the upcoming rally phase a strong technical base.
Even if there may be some short-term volatility, the market structure seems to support another big upward advance, with several analysts’ targets pointing to the $148,000-$189,000 level in the next several months. The current consolidation phase, which is marked by whales taking profits and short-term holders doing things, is similar to prior cycles that came before big breakouts to new all-time highs.
- Check out our free forex signals
- Follow the top economic events on FX Leaders economic calendar
- Trade better, discover more Forex Trading Strategies
- Open a FREE Trading Account
- Read our latest reviews on: Avatrade, Exness, HFM and XM
Related Articles

Sidebar rates
Related Posts
