Ethereum Surges Past $4,300, Technical Patterns Signal Potential Rally to $10,000-$20,000
Ethereum (ETH) is experiencing a powerful bullish surge, holding above the $4,300 mark and posting a remarkable 21.5% gain over the past 7
Quick overview
- Ethereum is experiencing a bullish surge, holding above $4,300 with a 21.5% gain over the past week.
- Technical analysts predict a potential rise to $6,000 based on the Wyckoff Accumulation pattern and a breakout from a multi-year triangle.
- Fractal analysis suggests Ethereum could reach between $10,000 and $20,000 in the next six to eight months, drawing parallels to past performance.
- Short-term on-chain metrics present mixed signals, with a critical resistance level at $4,400 that could determine the next price movement.
Ethereum ETH/USD is experiencing a powerful bullish surge, holding above the $4,300 mark and posting a remarkable 21.5% gain over the past seven days. Analysts are becoming more and more positive about ETH’s future after it broke through important resistance levels. Several technical patterns are coming together to show that there is a lot of room for growth in the coming months.
Wyckoff Accumulation Pattern Points to $6,000 Target
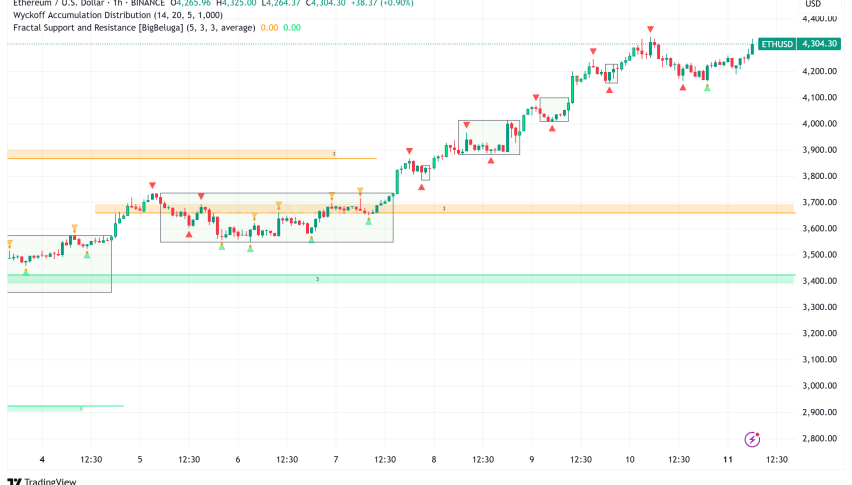
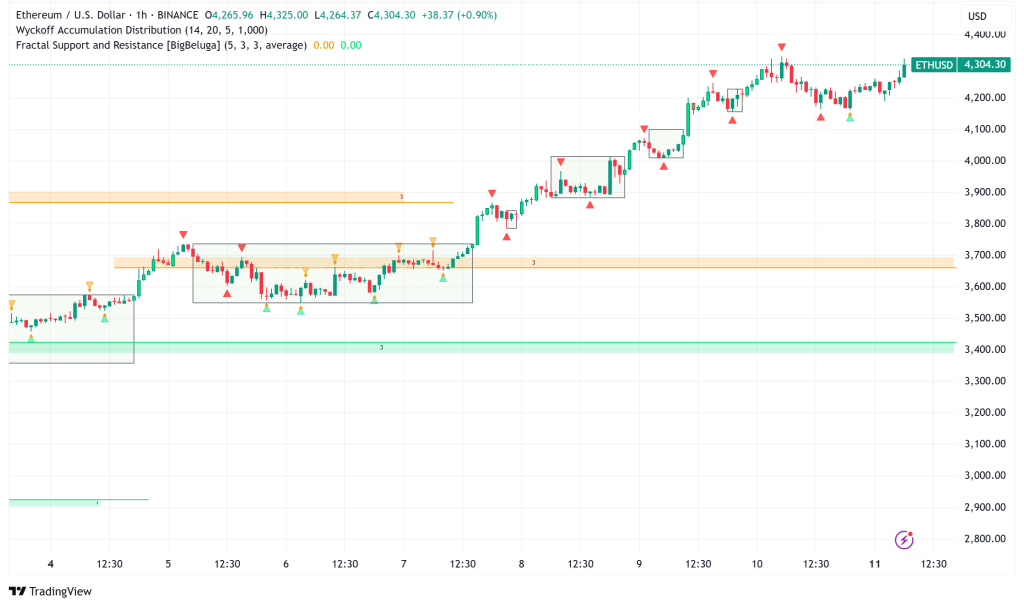
Lord Hawkins, a technical analyst, says that Ethereum is breaking out of a textbook Wyckoff Accumulation pattern. This pattern has been accumulating for months as the market dealt with selling pressure. According to Wyckoff theory, the recent rise above $4,200 is a “Sign of Strength” (SOS), which is usually followed by a short pullback to confirm the current uptrend.
If this pattern goes as planned, ETH might enter a markup phase when demand is more than supply. This would push prices toward the goal price of $6,000. This might mean a 39% gain from where we are now, and it would be a clear breach above Ethereum’s previous all-time high of $4,950.
Multi-Year Triangle Breakout Suggests $8,000 Trajectory
Analysts Crypto Rover and Titan of Crypto add to the positive story by pointing out that ETH broke out of a symmetrical triangular pattern that has been going on for years. This technical pattern, which has its peak between $4,000 and $4,200, shows a measured climb toward the $8,000 area, which is more than 90% higher than current pricing.
There is evidence from the past that supports this positive view. Ethereum did a similar triangle breakout in April 2020 that led to a 950% rise. This shows how powerful these long-term technical patterns can be when they are validated by rising volume and good market circumstances.
Fractal Analysis Reveals $20,000 Potential
Nilesh Verma’s fractal study is probably the most ambitious. It says that Ethereum might reach $20,000 in six to eight months. This prediction is based on how ETH has acted in the past when it bounced back strongly after testing major support levels at the bottom. In the past, in January 2017 and April 2020, the increases were more than 8,000% and 950%, respectively.
The current situation is similar to these past events, with ETH bouncing back strongly from the $1,750–$1,850 support zone in April 2025. If the fractal is correct, Ethereum may keep going up until April 2026, with targets between $10,000 and $20,000 in the best case.
ETH’s On-Chain Metrics Present Mixed Short-Term Signals
Long-term technical patterns seem quite positive, but on-chain research shows a more complicated picture for short-term market movement. According to CryptoQuant analyst CryptoOnChain, Ethereum’s Exchange Supply Ratio (ESR) has been going down consistently since 2022. It is presently about 0.16. This drop in ETH held by exchanges usually means that people are holding on to their coins longer and there is less selling pressure.
But metrics that are exclusive to Binance suggest a worrying discrepancy. The exchange’s ESR has gone up to almost 0.04 since early 2025, and positive net inflows have gone up as ETH gets closer to the important $4,400 resistance line. This isolated buildup on the world’s biggest exchange could mean that people are trying to make money in the short term.
Ethereum Price Prediction: Bullish Medium-Term, Cautious Near-Term
Based on both technical and on-chain analysis, Ethereum looks like it will make big gains in the medium term. Depending on market conditions and how long the momentum lasts, there are several feasible objectives between $6,000 and $20,000.
The $4,400 resistance level is a very important test in the short term, though. If the price breaks above this level, it might start the next leg up above $4,800. If it doesn’t, it could go back down to the $3,950-$4,000 support zone.
- Check out our free forex signals
- Follow the top economic events on FX Leaders economic calendar
- Trade better, discover more Forex Trading Strategies
- Open a FREE Trading Account
- Read our latest reviews on: Avatrade, Exness, HFM and XM
Related Articles


Sidebar rates
Related Posts
