Bitcoin Stabilizes Above $122K as “Real Liquidity” Surge Signals Path to New Highs
Bitcoin is trading above $122,000, holding steady after a big drop from its all-time high of $126,200 earlier this week. Even though it fell
•
Last updated: Thursday, October 9, 2025
Quick overview
- Bitcoin is currently trading above $122,000 after a recent drop from its all-time high, with rising institutional demand indicating potential for upward movement.
- Market data shows a bullish reset in derivatives, with significant buying pressure and a positive shift in buy/sell dynamics.
- US-based investors are aggressively accumulating Bitcoin, as evidenced by a high Coinbase Premium Gap, signaling strong demand despite short-term volatility.
- Technical analysis suggests that Bitcoin could break through the $125,000 resistance, with predictions of significant upside potential through 2026.
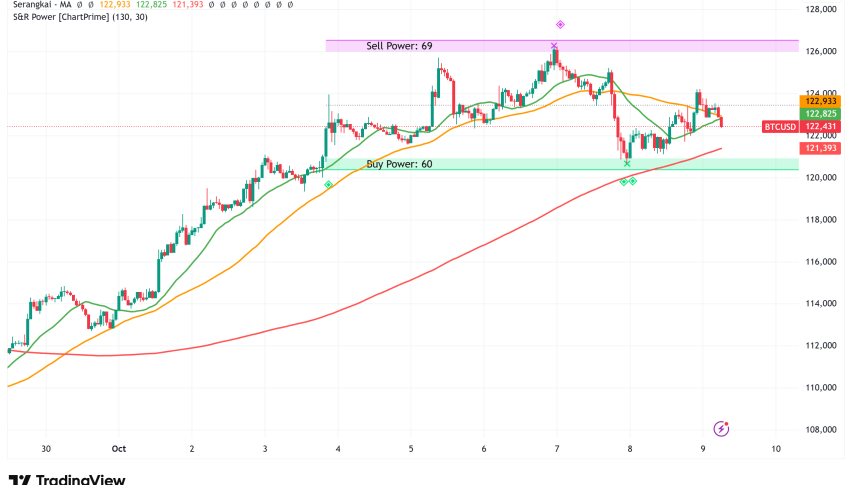
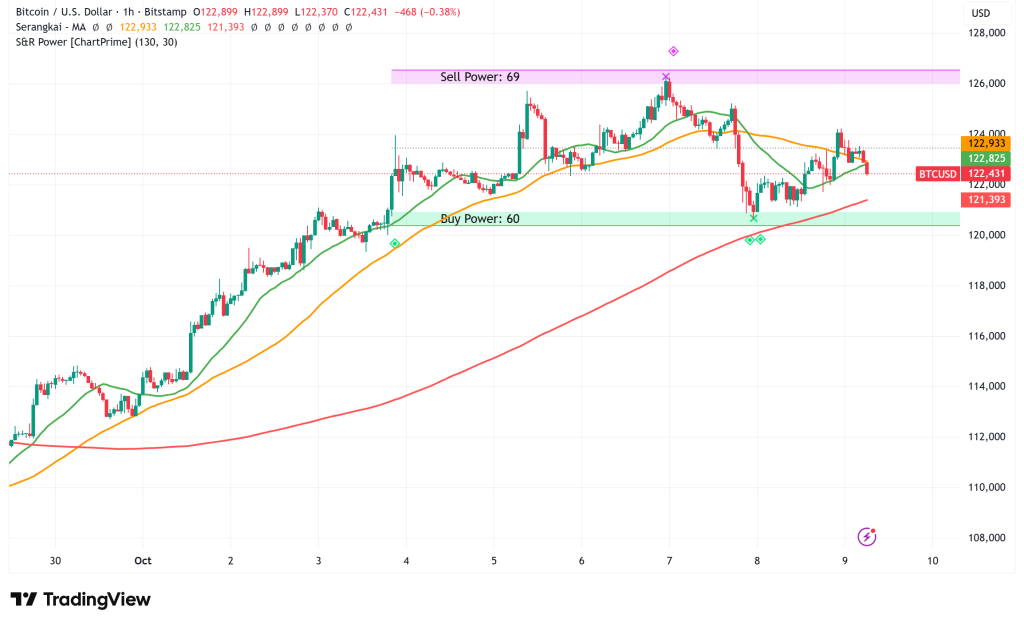
Bitcoin BTC/USD is trading above $122,000, holding steady after a big drop from its all-time high of $126,200 earlier this week. Even though it dropped more than 4% to the $120,000 level, important market data shows that the cryptocurrency is setting itself up for its next upward move. This is because institutional demand is rising and buying pressure is at its highest level since July.
Derivatives Markets Show Bullish Reset After Healthy Correction
It looks like the recent drop was a required reset instead of the start of a bigger drop. CryptoQuant data shows that Bitcoin’s net taker volume, which shows the difference between buy and sell orders, has gone up a lot from a very pessimistic figure of negative $400 million to neutral levels. This change shows “a true shift in dominance between buying and selling pressure,” which is identical to what happened during April’s downturn, which led to a 51% rally over 13 weeks.
Joao Wedson, the CEO of Alphractal, said that the buy/sell pressure delta is still quite positive. He said, “Metrics like this can take you to a whole new level, greatly improving your ability to make decisions.” The way people took profits after the all-time high shows that the market is behaving in a disciplined way, not in a panic.
Swissblock analytics backed this up by saying that short-term profit-taking has happened near $126,000, but it has been “controlled, not panic-driven.” The company thinks that staying above the $120,000–$121,000 area would prove a “healthy cooling phase” and prepare the basis for more upward movement.
Record US Institutional Accumulation Via Coinbase Signals Strong Demand
On-chain data showing that US-based investors are aggressively accumulating is probably the most convincing bullish sign. The Coinbase Premium Gap, which shows the difference in pricing between Coinbase and other global exchanges, has reached its second-highest level since the spot Bitcoin ETF launch earlier this year.
Maartunn, a top analyst, pointed out this change as proof of a big purchasing binge by US investors who are willing to pay more than traders on sites like Binance or OKX. In the past, big jumps in the Coinbase Premium Gap have come before big market growth periods and new all-time highs, as US capital flows became more important in Bitcoin-led rallies.
This institutional demand shows that even though short-term traders had to sell during the recent correction, demand from US-based buyers through regulated platforms and ETFs is still growing. Even when the market is volatile in the short term, the continual flow of cash into it is very important for its long-term strength.
Binance Data Confirms Strongest Buying Momentum Since July
Binance data suggests that buying was very strong in early October, which supports the bullish story. Bitcoin’s price went up from about $117,000 to $124,000, and on certain days, net purchasing pressure was over $500 million, which means that more people were buying than selling by that much.
The imbalance ratio hit 0.23, which means that purchase orders were about 23% greater than sell orders. The Z-Score jumped to 0.79, which means that there was more buying activity than usual on that day. The amount of Bitcoin traded per day is at its highest level since July, which suggests that the currency’s rise is based on real liquidity rather than short-term speculation.
These numbers show that institutional investors and whales are getting back into the market, not just short-term excitement. The behavior is very different from how weak it was in September, and it signals that any drop toward $120,000 could be a good time to buy more rather than the start of a bigger correction.
BTC/USD Technical Outlook: Bulls Eye $125K Breakout
From a technical point of view, the structure of Bitcoin’s chart is still quite optimistic. The 8-day and 21-day moving averages are both going higher, which means that the current uptrend will continue. The 50-day moving average is still considerably below the current price levels, which means that bulls still have the upper hand even though things have been volatile lately.
The $120,000–$121,000 zone used to be resistance, but now it is short-term support. If Bitcoin stays at this level, it could attract more buyers who want to break through the $125,000 resistance and start a new phase of price discovery.
But if it doesn’t stay above $120,000, it might go back to the $117,500 region, which is where the next big support level is. This kind of move would still be a good correction after the recent 15% rise, and it wouldn’t necessarily mean that the overall bullish structure was wrong.
BTC/USD
Bitcoin Price Prediction: Path to $140K+ Through 2026
Market analysts are predicting a lot of upside potential until 2026. Macro-crypto experts say that Bitcoin is moving into what they call a “fear bubble.” This time, it’s not because of greed and speculation like in 2017, but because people are worried about monetary debasement and AI disruption.
The base case scenario sees good performance through the end of 2025, followed by turbulence in early 2026 as markets debate the four-year cycle. This is followed by a last parabolic acceleration that could be even bigger than what happened in 2017. Some analysts say that policy changes including possible rate cuts, yield curve control, and fiscal stimulus could be the reasons why Bitcoin could go up a lot.
A convincing break over $125,000–$126,000 in the near future would confirm the uptrend’s return and could lead to the $140,000–$150,000 range. The fact that institutions are purchasing more Bitcoin, that there is real liquidity coming in, and that the futures market is getting better means that Bitcoin is still in a good position to keep going up. Any drops are expected to be met by strong buying demand from both US institutions and worldwide whales.
- Check out our free forex signals
- Follow the top economic events on FX Leaders economic calendar
- Trade better, discover more Forex Trading Strategies
- Open a FREE Trading Account
- Read our latest reviews on: Avatrade, Exness, HFM and XM
ABOUT THE AUTHOR
See More
Arslan Butt
Lead Markets Analyst – Multi-Asset (FX, Commodities, Crypto)
Arslan Butt serves as the Lead Commodities and Indices Analyst, bringing a wealth of expertise to the field. With an MBA in Behavioral Finance and active progress towards a Ph.D., Arslan possesses a deep understanding of market dynamics.
His professional journey includes a significant role as a senior analyst at a leading brokerage firm, complementing his extensive experience as a market analyst and day trader. Adept in educating others, Arslan has a commendable track record as an instructor and public speaker.
His incisive analyses, particularly within the realms of cryptocurrency and forex markets, are showcased across esteemed financial publications such as ForexCrunch, InsideBitcoins, and EconomyWatch, solidifying his reputation in the financial community.
Related Articles

Sidebar rates
Related Posts
