Ethereum Faces Critical $3,600 Support Test Amid ETF Outflows and Technical Breakdown
Ethereum is trading at about $3,600, which is down more than 4.5% in the last 24 hours. This is because more and more institutions are
Quick overview
- Ethereum is currently trading at approximately $3,600, down over 4.5% in the last 24 hours due to increased institutional selling.
- US-based spot Ethereum ETFs have experienced significant outflows, losing $363.8 million in three days, indicating a shift in institutional sentiment.
- Technical analysis suggests Ethereum could drop to around $2,870, as it follows a descending triangle pattern and has broken below key support levels.
- Despite the bearish outlook, a longer-term analysis indicates a potential path to $8,000 if Ethereum can stabilize and break above $4,900.
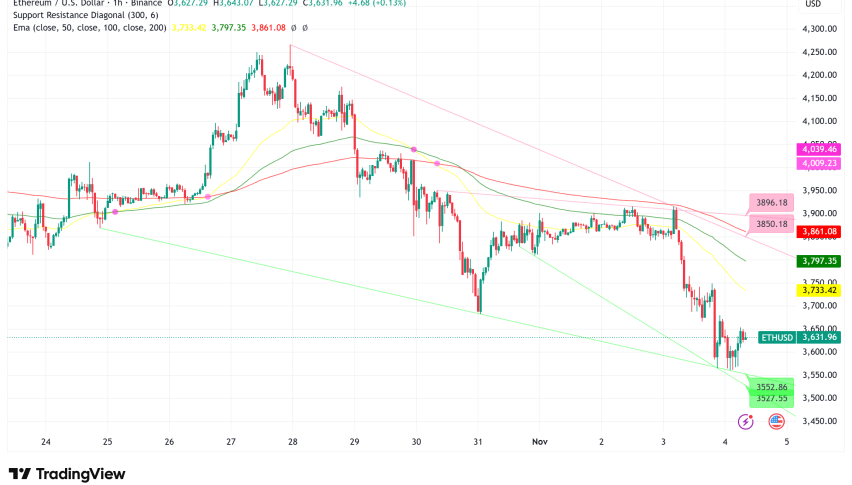
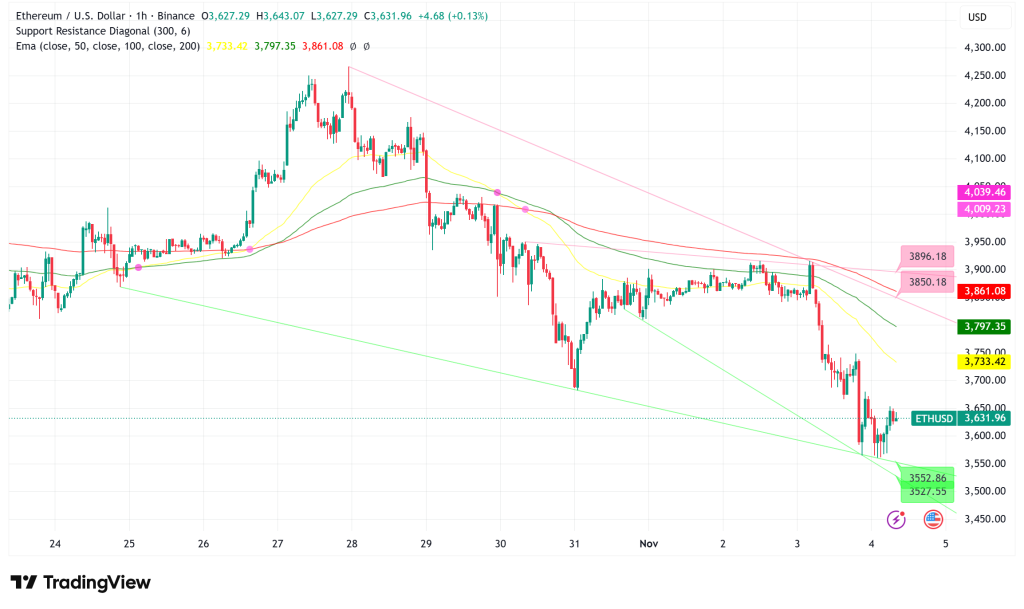
Ethereum ETH/USD is trading at about $3,600, which is down more than 4.5% in the last 24 hours. This is because more and more institutions are selling it and technical indications are pointing to a bearish trend. This could send the world’s second-largest cryptocurrency below $3,000. The drop is happening because spot Ethereum ETFs are losing money and a key chart pattern shows that prices will go down even more.
Institutional Demand Evaporates as ETF Outflows Accelerate
The main reason Ethereum has been weak lately is that US-based spot Ethereum exchange-traded funds have been leaving for a long time. SoSoValue data shows that these investment vehicles have lost $363.8 million over the past three days, which is a clear evidence that institutional opinion has changed.
The bleeding goes beyond ETFs. According to data from StrategicETHreserve.xyz, the total amount of strategic reserves and ETFs held has dropped by 124,060 ETH since October 16. This is a bad sign that demand is falling among big companies and institutions. Ted Pillows, an analyst, said that “Ethereum treasury companies are still going down,” and that BitMine is the only real buyer in the current market.
This institutional retreat seems to be partly caused by money moving into newer options. The recent debut of US-based spot Solana ETFs has brought in money for four days in a row. This suggests that investors are looking for new alternatives and moving away from Ethereum.
ETH/USD Technical Analysis: Descending Triangle Pattern Points to $2,870
Since October 7, Ethereum’s price has been following a traditional descending triangle pattern on the eight-hour chart. This bearish reversal pattern has a flat support level around $3,700 and a downward-sloping resistance line. This makes the price range get smaller, which usually ends with a breakdown.
“ETH has broken below the descending triangle pattern and is now testing the breakdown level,” said analyst CryptoBull_360. “If the breakdown level is retested and it works, it means that the downtrend will keep going.”
The measured move from this pattern suggests a price target of $2,870, which would be a drop of 22% from where it is now. This aim is in line with the triangle’s highest point, which is what classic technical analysis says it should be.
The SuperTrend indicator gave a sell signal on Thursday when it changed from green to red and climbed above price. This made the negative view more credible. The last sell signal from this momentum indicator on October 7 came before a 22% drop from $4,750 to $3,700, so you shouldn’t dismiss the present warning.
Pillows said that ETH is currently in a “crucial support zone” around $3,700 and warned that if it doesn’t quickly go back above $4,000, it might fall even further to $3,500 or perhaps $3,350.
Ethereum Price Prediction Dream Scenario: Path to $8,000 Remains Possible
Ali Martinez, an analyst, has found a longer-term positive route for Ethereum based on a multi-year Parallel Channel pattern on its three-day chart, even though the short-term setting looks gloomy. In this “dream scenario,” ETH would stay at its current levels and eventually break over the channel’s top threshold, which is about $4,900.
If this happens, Ethereum might rise to $8,000, which is the height of the channel measured from the resistance level. But for this hopeful prediction to come true, ETH needs to first stabilize and turn around its present slump. This is a big ask because institutions keep selling and the technical structure keeps becoming weaker.
- Check out our free forex signals
- Follow the top economic events on FX Leaders economic calendar
- Trade better, discover more Forex Trading Strategies
- Open a FREE Trading Account
- Read our latest reviews on: Avatrade, Exness, HFM and XM
Related Articles


Sidebar rates
Related Posts
