Bitcoin’s New Statistical Model Predicts Slower, More Stable Growth Amid $106K Wall
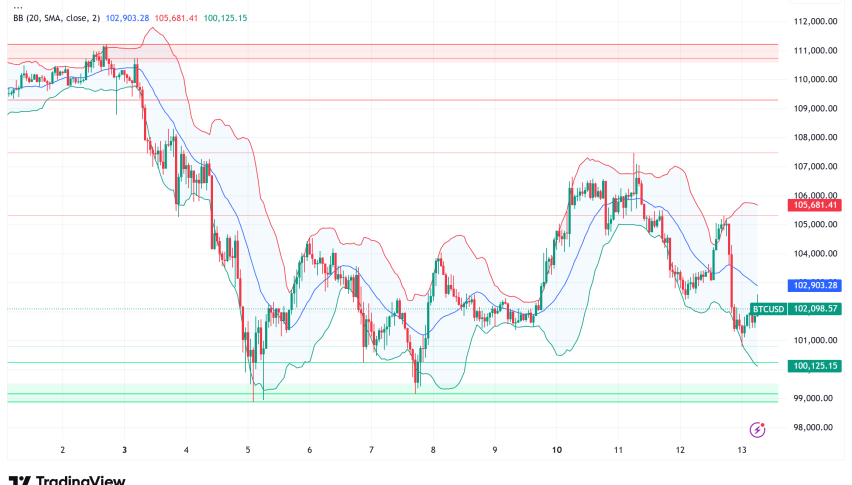
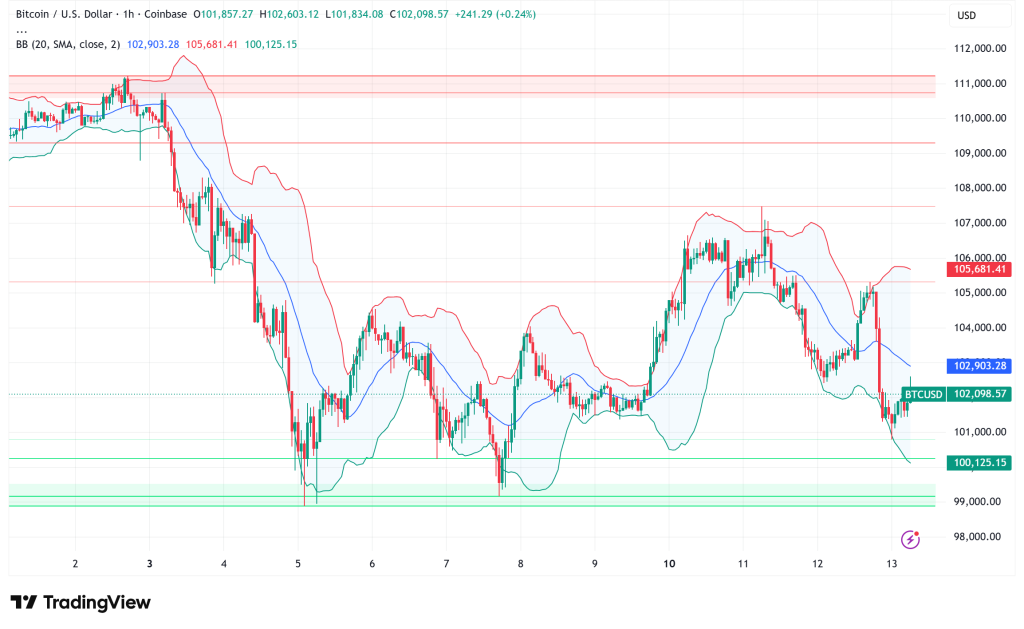
Bitcoin is trading above $102,000 right now. In the previous 24 hours, it has been quite stable, but there are signs of a major change in
Quick overview
- Bitcoin is currently trading above $102,000, showing signs of stability but still below its all-time high of $126,220.
- The Diaman Ratio indicates that Bitcoin has not entered a speculative 'bubble' phase, suggesting more stable growth compared to previous cycles.
- Institutional adoption, particularly through spot Bitcoin ETFs, has altered market dynamics, reducing the traditional boom-bust cycle.
- Long-term holders are selling off Bitcoin, raising concerns about market confidence amid increasing interest in privacy-focused cryptocurrencies.
Bitcoin BTC/USD is trading above $102,000 right now. In the previous 24 hours, it has been quite stable, but there are signs of a major change in the way the cryptocurrency behaves. Prices are still significantly below the recent all-time high of $126,220, but technical indications and on-chain data show that the asset has entered a new period of maturity that is different from its usual four-year cycle.
The Death of Bitcoin’s Exponential Growth Phases
The Diaman Ratio, a deterministic indicator that monitors growth rates on a logarithmic scale, shows that Bitcoin has not entered a “bubble” phase in the current cycle that started in 2024. The Diaman Ratio has stayed below 1.0 during the recent rally, which is different from prior cycles when it went over this level (showing more-than-exponential growth). This suggests that the growth is stable rather than speculative.
Bitcoin has through huge boom periods in 2011, 2013, 2017, and 2021, and each time it fell by 75% to 91% in value. But the price rise from $15,000 in December 2022 to $126,000 at recent highs in this cycle didn’t happen with the usual exponential acceleration that happened before other collapses.
This fundamental change is backed up by annual volatility assessments. Bitcoin’s volatility has dropped from about 140% in its early years to about 50% now. This shows that prices are more stable and the market is more mature. Over the past three years, rolling one-year returns have also flattened a lot. This is because Bitcoin’s market capitalization has increased from $20 billion to more than $2 trillion, which has caused average annual returns to go down.
Institutional Forces Reshape Market Dynamics
The approval of spot Bitcoin ETFs in the US has been a turning point. BlackRock’s IBIT ETF became the fastest-growing financial product in history, reaching $100 billion in assets under management in less than three years. This institutional adoption has basically stopped the boom-bust cycle that Bitcoin used to go through.
Even if Bitcoin spot ETFs saw $524 million in net inflows on a recent Tuesday, buyers are still not very excited. Companies that use Bitcoin reserve strategies, including Strategy (MSTR) and Metaplanet, have lost their incentive to issue more shares because the mNAV multiple (the ratio of Bitcoin holdings to enterprise valuation) has gone down amid recent price drops.
Long-Term Holders Add Selling Pressure
The migration of dormant Bitcoin from accounts that are older than 2018 is bad news for bulls. Addresses linked to early arbitrage trading sent over 1,800 BTC (worth more than $200 million) to the Kraken exchange, which is a significant transfer. Long-term holders selling raises questions about how confident people are as worries rise about quantum computing risks and Bitcoin’s technical obsolescence compared to privacy-focused alternatives.
Privacy coins have gone up a lot in value: Zcash is up 99% in 30 days, Decred is up 74%, and Dash is up 37%. This suggests that investors are moving their money to assets that are thought to be safer.
Liquidity Indicators Signal Potential Accumulation Phase
On-chain measurements give a mixed picture. The Stablecoin Supply Ratio (SSR), which measures the entire market cap of stablecoins to Bitcoin’s market cap, has dropped below the 13 range. This is a level that has been historically linked to market bottoms in mid-2021 and into 2024. Also, data from the Binance exchange reveals that stablecoin balances are going up while Bitcoin reserves are going down. This suggests that money is sitting on the sidelines waiting for the right time to enter the market.
Technical Resistance and Dollar Strength Create Headwinds
Since early November, Bitcoin has had a hard time keeping prices over $106,000. It has faced overhead resistance even while the S&P 500 is trading just 1% below all-time highs. The US Dollar Index is going up, which shows that people are more confident in how the US government handles money. This is bad news for Bitcoin because when the dollar is strong, demand for cryptocurrencies usually goes down.
Bitcoin Price Outlook: Measured Growth Replaces Moonshot Predictions
Some commentators have suggested aggressive deadlines for Bitcoin to reach $1 million, while statistical forecasts based on diminishing volatility and returns show that it will take 15 years instead. Based on the asset’s growth trajectory, it seems unlikely that it will be worth $13 million by 2040.
But at the moment, the risk-reward balance may be in favor of purchasers. Low SSR ratings, falling exchange reserves, and the fact that prices tend to go up in the latter few months of the year make it possible for new buying to quickly push prices up if sentiment changes.
Structural support levels seem to limit the downside, but a strong break below the current liquidity zones could lead to a worse fall. If the next big crypto winter comes, analysts say it will probably cause losses in the 50–60% area instead than the terrible 75–91% drops that happened in prior cycles.
- Check out our free forex signals
- Follow the top economic events on FX Leaders economic calendar
- Trade better, discover more Forex Trading Strategies
- Open a FREE Trading Account
- Read our latest reviews on: Avatrade, Exness, HFM and XM
Related Articles


Sidebar rates
Related Posts
