Chart Chaos: Why US Stocks Face a 10% Tumble Soon
US stock market chart patterns show that the recent decline could escalate into a full-blown correction of at least 10%.

Quick overview
- The US stock market is facing a potential correction of at least 10% following a significant decline in the S&P 500 Index, which dropped 2.28% recently.
- The S&P 500 closed below its 50-day moving average for the first time in 139 sessions, indicating a shift in market momentum.
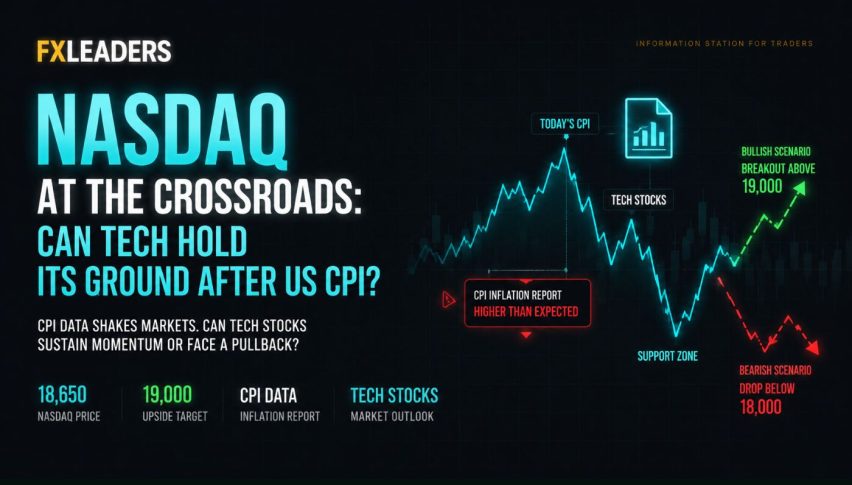
- High-flying technology stocks, which previously drove market gains, are now contributing to weakness as investor sentiment shifts from optimism to skepticism.
- Upcoming retail earnings reports and government economic data may provide further insights into consumer behavior and market trends.
US stock market chart patterns show that the recent decline could escalate into a full-blown correction of at least 10%. The S&P 500 Index’s dip from its peak in October was exacerbated on Monday by a strong selloff, which dropped the index by 2.28% to 3.2%—the largest decline from its peak since February and April.
The benchmark index closed below its 50-day moving average for the first time in 139 sessions, ending the second-longest period this century above that closely watched trend line.

Additionally, the index fell more than fifty points below Goldman Sachs Group Inc.’s benchmark of 6,725. Early in the day, Lee Coppersmith noted the potential for this situation to turn buyers into sellers, particularly among trend-following quant funds or Commodity Trading Advisors (CTAs).
John Roque, head of technical analysis at 22V Research, claims that the Nasdaq Composite Index is also displaying some “ugly” signals. He claimed that more of the index’s roughly 3,300 members are trading at 52-week lows than highs, indicating internal market weakness that makes a further rally improbable. Roque advised investors to take a defensive stance, saying that if it wasn’t evident during the first week of November, “it should be now: a correction is occurring.”. He anticipates that the Nasdaq Composite, which has dropped more than 5% from its previous high, will continue to decline by up to 8% before testing support at 22,000.
The high-flying technology stocks that propelled the S&P 500’s 38% rise from its April low to its October high have been central to the recent market weakness. With their stalled progress, the market is now leaning on industries that are more vulnerable to signs of a slowing economy and declining consumer confidence.
Among the Magnificent Seven tech stocks, Alphabet Inc. is the only one that has lost nearly 4.5% this month. Most of this year’s market gains have come from that group. As investors scrutinize the substantial borrowing needed to finance growth, sentiment around the artificial intelligence trade has shifted from euphoria to skepticism. For instance, Amazon.com Inc. sought $15 billion in bonds from the credit market on Monday.
Fundamentals may come back into focus later in the week, while technical chart weaknesses dominated market discussions on Monday.
Retailers such as Walmart Inc., The Home Depot, and Target Corp. will present findings and analyses regarding the upcoming holiday shopping season. Nvidia Inc. will be the last major mega-cap tech company to release its latest results.
Additionally, government economic data that hasn’t been released in seven weeks will start to emerge. Lower-income consumers appear to be under increasing pressure as the economy slows, particularly in the labor market. Even if this decline worsens somewhat, 2025 could still be a favorable year for stocks, as the S&P 500 is still up more than 13% year to date, and the Nasdaq Composite is holding a gain of nearly 18%.
- Check out our free forex signals
- Follow the top economic events on FX Leaders economic calendar
- Trade better, discover more Forex Trading Strategies
- Open a FREE Trading Account
- Read our latest reviews on: Avatrade, Exness, HFM and XM
Related Articles

Sidebar rates
Related Posts
