Bitcoin Holds Below $88K as $14B Options Expiry and Economic Headwinds Test Bull Resolve
Bitcoin is trading just under $88,000, which is only a small shift from the last 24 hours. Traders are getting ready for Friday's huge $14B
Quick overview
- As of November 26, 2024, Bitcoin is trading just under $88,000, with traders preparing for a significant $14 billion options expiration that could influence future price direction.
- Technical indicators suggest Bitcoin is consolidating, with a critical battleground near $89,000, where bullish traders need to reclaim to see gains.
- Recent economic data shows a sluggish job market and declining consumer confidence, which may lead to Federal Reserve intervention and impact crypto markets.
- Despite recent losses, bullish sentiment remains as traders are adding call options in the $100,000–$112,000 range, indicating optimism for medium-term price movements.
As of November 26, 2024, Bitcoin BTC/USD is trading just under $88,000, which is only a small shift from the last 24 hours. Traders are getting ready for Friday’s huge $14 billion options expiration, which might set the price direction for the foreseeable future. After falling over 30% from its all-time high of $126,210 in October, the leading cryptocurrency has had a hard time keeping up its speed. Technical indicators show that it is consolidating rather than giving up.
Friday’s Options Expiry Favors Bears Unless Bulls Can Reclaim $89K
The upcoming options expiration makes things hard for bullish traders from a mathematical point of view. The total open interest for call options is 104,300 BTC, which is worth $9.12 billion. However, because the price has dropped recently, 84% of these bets are now above $91,000, which means they will be worthless if BTC stays close to its present level. On the other hand, the total open interest for put options is 67,877 BTC ($5.92 billion), with 31% of them at $84,500 or lower, which suggests that they are more in line with current market conditions.
Analysts who keep an eye on derivatives positioning say that the main battleground is near $89,000. Five likely scenarios for the expiry show quite different results: prices between $85,000 and $87,000 favor put instruments by $1.9 billion, while the $87,001 to $88,000 range still favors bears by $800 million. There is a fair outcome between $88,001 and $89,000, but bulls need prices to go above $89,000 to see real gains. The $90,001 to $92,000 range favors calls by $3.8 billion.
Ted, a market analyst who looks into liquidation heatmaps, said that Bitcoin recently had a lot of selling pressure between $88,500 and $89,000. This caused a decline that could test the $85,000 support level again.
Macro Headwinds: Weak Employment and Consumer Confidence Data
The basics of the economy have put further pressure on crypto markets. ADP, a payroll processor, said that US private enterprises lost an average of 13,500 positions per week over the past four weeks. This shows that the job market is sluggish in a consumer-driven economy. The US Conference Board said that consumer confidence fell from 95.5 in October to 88.7 in November. For the eighth month in a row, income and business expectations stayed below the neutral 80% level.
These worsening signs, on the other hand, make people more hopeful that the Federal Reserve will step in. Gold went up 1.2%, while the Russell 2000 small-cap index went up 1.9% as traders thought about possible actions to improve liquidity. President Trump’s “Genesis Mission” executive order, which is meant to speed up the development of artificial intelligence, has also made people hopeful that economic stimulus will help high-growth areas like crypto.
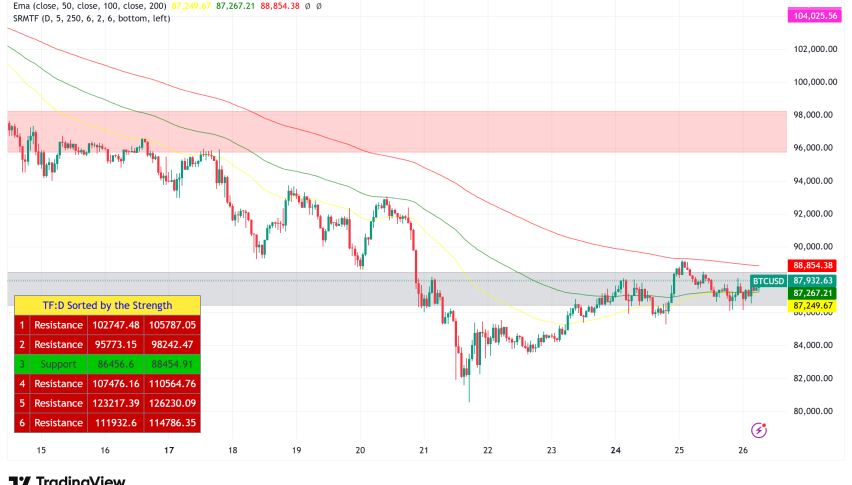
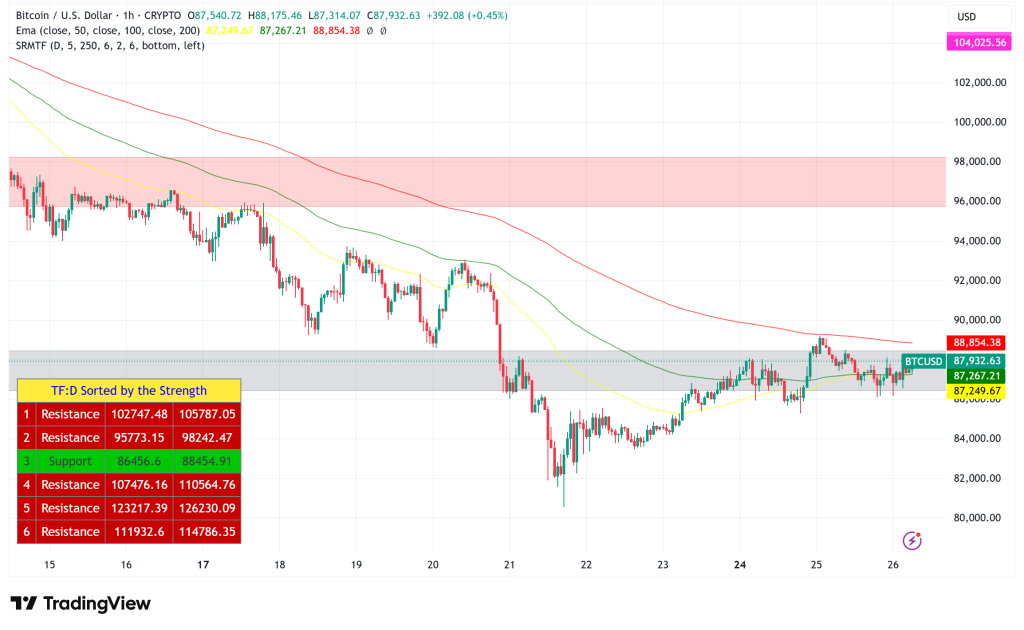
BTC/USD Technical Analysis: MAs Signal Persistent Bearish Structure
The chart for Bitcoin shows a definite decline. The price is below the 50-day, 100-day, and 200-day moving averages, which all slope downward to show that the market is bearish. The latest bounce from the $80,000 level shows aggressive purchasing at very low levels, which could mean that a short-term bottom is forming. However, the recovery doesn’t have significant volume support, which suggests that buyers haven’t come back with conviction.
Previous support levels of about $95,000 and $100,000 have now become resistance, making it very hard for any rally to get off the ground. The first real indicator that bullish momentum has returned would be a sustained move above the 100-day moving average.
Technical analyst ijaz_crypto says that Bitcoin recently changed a big support zone into resistance after dropping liquidity to $80,600 and then bouncing back from a daily order block. The must-hold zone is between $85,000 and $85,600. To change the momentum toward the $98,000-$100,000 target range, the price needs to break out over $93,200.
Funding Rates Flip Negative: Classic Capitulation Signal
There has been a big change in how people act in derivatives markets. Funding rates, which stayed high during the correction, have suddenly dropped and gone negative, showing that the short side is in charge. Darkfost, an analyst, says that traders waited for Bitcoin to drop more than 30% before quickly moving into short positions. This is a common reaction that happens near market turning periods.
When financing dips below 0.01% (including built-in interest rates on exchanges like Binance), it shows that short positions are in charge. Negative funding suggests even more pessimistic positioning. This change from forced long unwinds to conviction-based short exposure is a typical sign of capitulation. In the past, these kinds of funding changes have often happened near the bottom of a market, which could lead to a time of disbelief where prices go up as shorts keep coming in.
Bulls Show Resilience Despite Recent Losses
Even though the setup is hard, bullish conviction stays strong. Over the past 48 hours, Bitcoin traders have added to their call option holdings in the $100,000–$112,000 band, which shows that they are still optimistic about the medium term. On-chain data shows that long-term holders are still buying, and supply is close to multi-year highs. This is a pattern that happens before big price changes.
The Coinglass heatmaps reveal that liquidity clusters are very strong at $97,000–$98,000 on the upside and $85,000 on the downside. This could make them magnets for price activity during big swings. If Bitcoin breaks over the present $89,000 ceiling, it might go toward the $93,000 supply zone. On the other hand, if it doesn’t hold $85,000, it could fall to $83,000 or perhaps $80,000.
Bitcoin Price Prediction: Consolidation Before Directional Breakout
Bitcoin looks like it will stay between $85,000 and $89,000 until Friday’s expiration, based on its technical structure and the way options are set up. The neutral outcome zone between $88,000 and $89,000 may draw in buyers as market makers hedge their positions, but a real rebound will only happen if prices rise over $91,000 to cancel out the negative options skew.
Short-term forecast (1–2 weeks): The price will stay between $83,000 and $92,000, but there will be more volatility around Friday’s expiry. If bulls can’t defend $87,000 and get back to $89,000, the odds are in favor of neutral to negative results.
In the next one to three months, if the $85,000 support level holds and the economy improves thanks to the Federal Reserve, Bitcoin might test the $95,000 to $100,000 range again by the end of the year. Institutional investors are still betting on the upside because they are buying calls at higher strikes.
- Check out our free forex signals
- Follow the top economic events on FX Leaders economic calendar
- Trade better, discover more Forex Trading Strategies
- Open a FREE Trading Account
- Read our latest reviews on: Avatrade, Exness, HFM and XM
Related Articles


Sidebar rates
Related Posts
