Bitcoin Holds Above $87,000: Mixed Signals as ETF Outflows Clash With Bullish Institutional Outlook
As Bitcoin looks to settle after a difficult time, it is currently trading at $87,835, a slight 3% increase over the previous day. It is
Quick overview
- Bitcoin is currently trading at $87,835, reflecting a 3% increase but remains 30% below its peak of $126,210.50 from October 2025.
- Recent spot ETF outflows of $358 million have raised concerns among Bitcoin bulls about institutional investors reducing their exposure.
- Technical indicators present a mixed outlook, with Bitcoin's volatility remaining stable despite a 31% price drop since October.
- Predictions for Bitcoin's price in 2026 vary widely, with some analysts forecasting a drop to $40,000 while others anticipate new all-time highs.
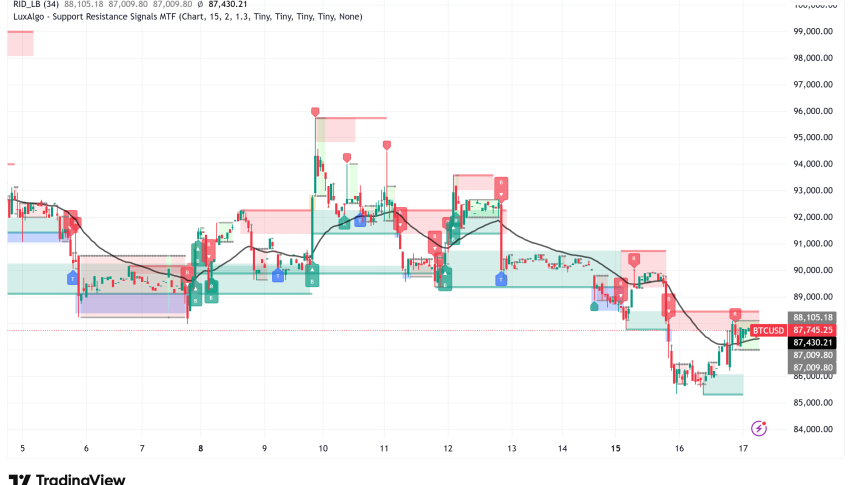
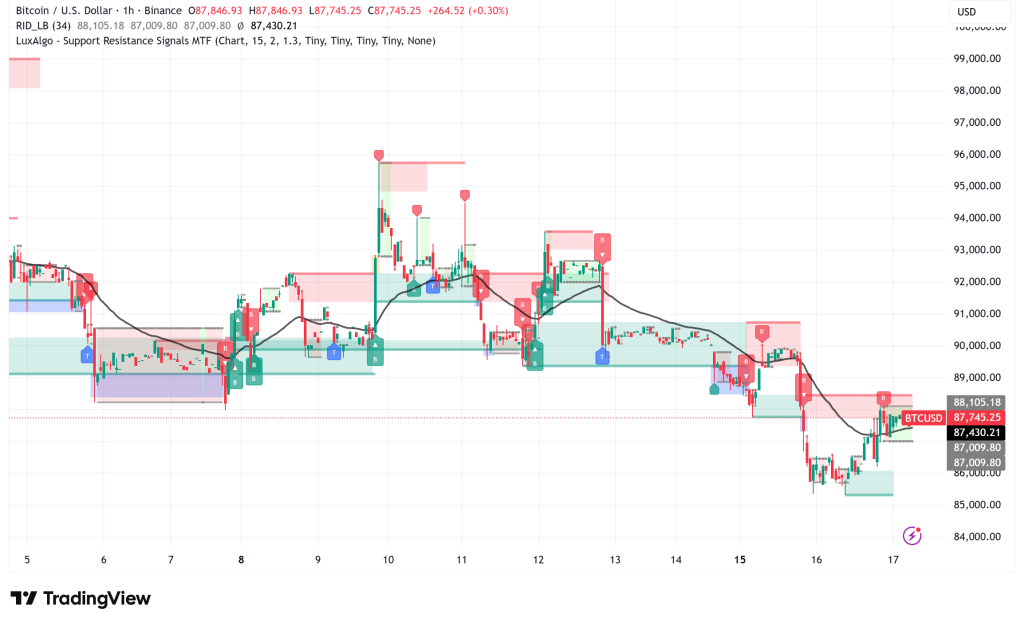
As Bitcoin BTC/USD looks to settle after a difficult time, it is currently trading at $87,835, a slight 3% increase over the previous day. It is unclear whether the current consolidation phase is a good correction or a more worrisome trend reversal, since the digital asset is still roughly 30% below its peak of $126,210.50, which was reached in early October 2025.
Bitcoin ETF Outflows Signal Shifting Institutional Sentiment
The recent spike in spot ETF outflows is the biggest worry for Bitcoin bulls right now. Spot Bitcoin exchange-traded funds had net withdrawals of $358 million on Monday, the biggest one-day outflow in more than three weeks. This move has increased conjecture that, following Bitcoin’s breach of the psychological $90,000 support level, institutional investors may start lowering their exposure.
After failing to recover the $94,000 resistance level for almost a month, the cryptocurrency is currently trading inside a defined range between $85,000 and $93,000. Expectations for Bitcoin to hit $100,000 by year’s end, a goal that was attainable only weeks ago, have been tempered by this consolidation pattern and declining ETF flows.
BTC/USD Technical Indicators Present Mixed Picture
The bearish narrative may be premature, according to a number of technical criteria, despite the alarming outflow data. Since May, the correlation between Bitcoin and gold, which is frequently used to evaluate whether the cryptocurrency serves as a substitute store of value, has exhibited erratic trends. Instead of just following conventional safe havens, Bitcoin is establishing itself as a distinct asset class, as evidenced by the 60-day correlation metric’s oscillations between positive and negative area.
More significantly, neither correlation nor volatility measurements have been significantly affected by the recent 31% price drop since October. The 3-month implied volatility of Bitcoin is approximately 53%, which is about the same as the volatility profile of Tesla and consistent with high-growth technology stocks such as Broadcom and Nvidia. The constancy of volatility metrics indicates that institutional investors’ opinion of the asset’s risk has not changed significantly.
Over the last 18 months, Bitcoin has outperformed the S&P 500 index by 7%, according to analysts, proving its durability even during periods of correction. The rather steady volatility profile suggests that market makers are not expecting big, unexpected moves, which would normally result in much higher implied volatility.
Divergent Price Predictions Create Uncertainty
The picture for the Bitcoin market in 2026 is radically different. A probable low of about $40,000 is anticipated by market analyst NoLimit sometime next year, which would represent a significant 54% drop from current prices. This prediction is based on prior cyclical trends, pointing out that during previous cycle resets, Bitcoin has dropped by 77–85%. According to NoLimit, major corrections are frequently preceded by present circumstances, including as large leverage, institutional participation, and compressed volatility.
According to the pessimistic scenario, a move toward $40,000 would be consistent with long-term moving averages, the liquidity gap caused by ETF approvals earlier in the cycle, and prior resistance-turned-support levels.
On the other hand, asset manager Grayscale predicted Monday that Bitcoin would reach new all-time highs in the first half of 2026. Growing institutional demand for alternative stores of value and increased legislative clarity, such as the GENIUS Act’s approval in 2025, are cited by Grayscale as important accelerators. The company highlights that investors are gravitating toward Bitcoin and other digital assets due to growing public debt and worries about the depreciation of fiat currencies.
This confidence was shared by Bitwise CIO Matt Hougan, who predicted that in 2026, Bitcoin will deviate from its conventional four-year cycle pattern, with institutional viewpoints being reshaped by decreased volatility and weaker equity correlations.
Bitcoin’s Market Structure Shows Capital Concentration
Nearly every cryptocurrency sector has underperformed Bitcoin over the last three months, according to recent onchain statistics from Glassnode. This indicates a market climate where capital concentration favors Bitcoin over other cryptocurrencies. But in the second part of the year, Ethereum ETH/USD movements have begun to erode Bitcoin’s advantage after deleveraging occurrences.
According to the statistics, institutional funds prefer to hold Bitcoin but are not making any sizable fresh wagers, indicating a cautious “wait-and-see” strategy as opposed to surrender.
Bitcoin Technical Outlook: Range-Bound Trading Likely
Technical analysts predict that Bitcoin will be range-bound between $86,000 and $89,000 in the near future. The decreasing trade volume suggests that neither buyers nor sellers have amassed enough strength to make a clear breakout in either direction.
On the upside, key resistance levels to keep an eye on are $88,000–$88,500, while support is firmly located at $85,000. While a clear move over $90,000 would probably rekindle bullish momentum toward the $100,000 psychological milestone, a verified break below this support level would lead to intensified selling down the $80,000 region.
- Check out our free forex signals
- Follow the top economic events on FX Leaders economic calendar
- Trade better, discover more Forex Trading Strategies
- Open a FREE Trading Account
- Read our latest reviews on: Avatrade, Exness, HFM and XM
Related Articles


Sidebar rates
Related Posts
