Bitcoin New Whale Distribution and “Greenland Tariffs” Threaten $85,000 Retest
Bitcoin (BTC) is currently above $88,000, which is a drop of almost 4% in the last 24 hours. The cryptocurrency is having a hard time
Quick overview
- Bitcoin is currently trading above $88,000, experiencing a nearly 4% drop in the last 24 hours and struggling to reclaim the $90,000 level.
- Newer Bitcoin whales are facing significant unrealized losses, with a realized price around $98,000, raising concerns about their potential selling behavior.
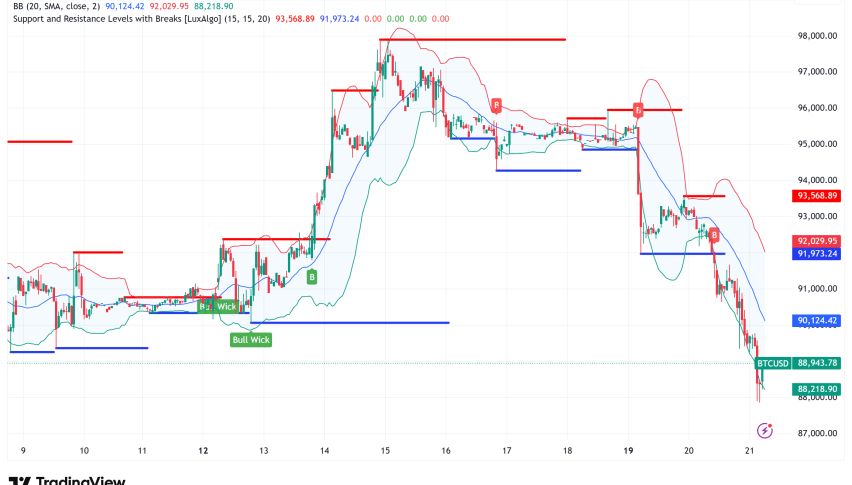
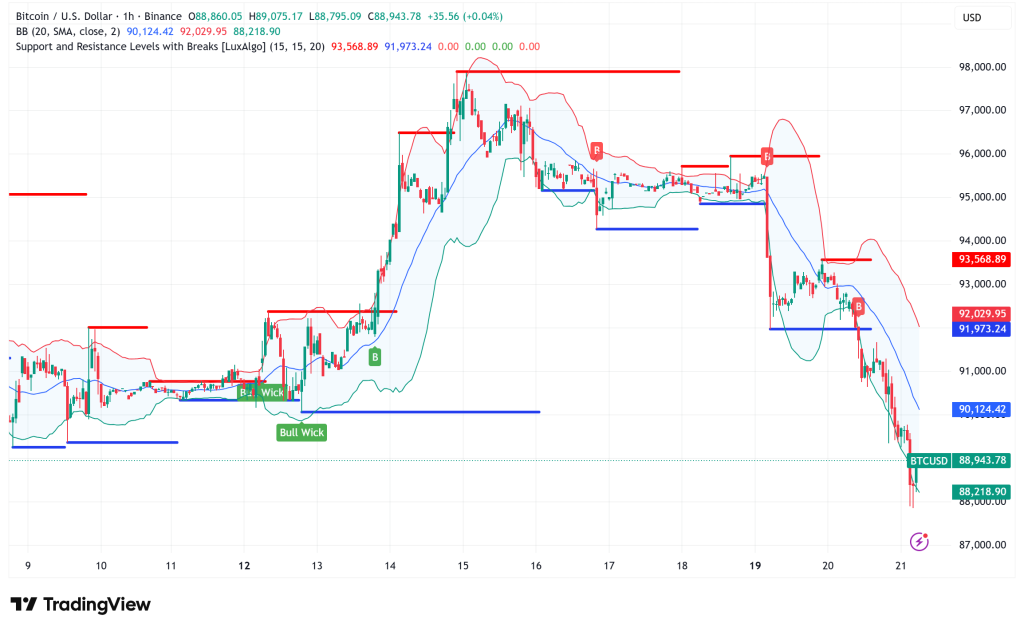
- Technical indicators suggest a possible test of the $85,000 support level, with significant selling pressure noted below $91,000.
- Despite the bearish outlook, strong institutional demand may provide a floor for Bitcoin prices, potentially preventing a severe decline.
Bitcoin BTC/USD is currently above $88,000, which is a drop of almost 4% in the last 24 hours. The cryptocurrency is having a hard time getting back above the psychological $90,000 level. The recent price changes have made several support levels stand out. Analysts say that a test of $85,000 is more and more possible in the immediate future.
New BTC Whale Cohort Controls Price Action Amid Unrealized Losses
A big change in the way the market works has happened: newer Bitcoin whales (those who own more than 1,000 BTC and have held them for fewer than 155 days) now have more realized capital than long-term investors who have been through numerous market cycles. CryptoQuant analyst MorenoDV says that this new group has a realized price of about $98,000, which means that they are currently down almost $6 billion in unrealized losses because BTC is trading below that level.
This is especially worrying because these newer whales are more likely to give up than long-term holders who have been holding for a long time and have a realized price close to $40,000. The fact that veteran holders are mostly idle shows that short-term volatility is being caused by capital under stress rather than strong conviction holders.
BTC/USD Technical Structure Points to Mid-$80K Range
From a technical point of view, Bitcoin has fallen below both the 21-period daily and 12-period weekly exponential moving averages (EMAs). This is a negative sign that usually comes before more losses. Trader XO said that BTC has broken through several previous higher lows, making a pattern that might cause the price to “gravitate” toward the mid-$80,000 level unless bulls can start a fast rescue rally.
Futures expert Dom called the current situation a “failed auction,” saying that Bitcoin temporarily broke above the value area high (VAH), which is the upper limit of the main trading range since November 2024, but then fell back inside. In the past, failed breakouts have had a high chance of turning back toward the value area low (VAL), which is now at $86,000.
Order flow data shows that traders are taking aggressive positions. Analyst exitpump has found that there is more than $300 million in selling pressure below $91,000. If Bitcoin goes back up to that level, this negative delta clustering could cause a short squeeze, but for now, it adds to the downside momentum.
Exchange Data Signals Elevated Distribution Risk
Exchange flow numbers don’t seem good for bulls. The exchange whale ratio has shot up to the 0.52–0.55 area, which means that big transactions are driving BTC inflows to exchanges. This is a trend that usually happens when people are selling or moving their money around. If this high ratio stays the same and Bitcoin doesn’t get back to the $95,000 to $98,000 level, distribution pressure might push the correction down to the $80,000 to $85,000 range.
But there are hints that things are starting to settle down. Darkfost, a contributor to CryptoQuant, said that whale-sized transfers to Binance have dropped drastically from the panic levels of late November, going from around $8 billion in monthly inflows to about $2.74 billion. This means that big holders are no longer selling a lot and may be taking a wait-and-see strategy.
BTC Bear Market Scenarios and Critical Support Levels
Raun Neuner, a market expert, talked about the worst-case scenarios based on past trends. Bitcoin’s bull markets usually reach their highest point about 532 days after each halving occurrence. This means that the current cycle’s top would be around October, when BTC briefly hit $125,000. If the market were to go into a full bear market, it could drop to $37,000, which is a 70–80% drop from its top. However, the 200-week moving average around $57,000 is a more immediate point of reference.
The technical picture for the foreseeable future shows that the next important support zone is between $84,000 and $85,000. If these levels don’t hold, pessimistic sentiment might grow stronger and fears of a bigger correction could grow.
Bitcoin Price Prediction: $85K Test Likely, But Institutional Demand Provides Floor
Bitcoin looks like it may test the $85,000 to $86,000 support zone in the next few days because of a mix of negative technical signs, high whale-to-exchange ratios, and fresh whale holdings that are underwater. The failed breakout above the value area high and the ongoing selling pressure below $91,000 make this downside scenario possible from a technical point of view.
But there are a number of things that could stop a terrible collapse from happening. Ki Young Ju, the CEO of CryptoQuant, said that institutional demand is still strong. US custodial wallets have added 577,000 BTC ($53 billion) in the previous year, and inflows are still coming in. Also, the big drop in panic-driven whale selling from November’s peak signals that the most aggressive phase of distribution may be over.
In the base case, Bitcoin tests $85,000 as support. If institutional buying takes up the selling pressure, it could rebound back. A return to $91,000 could cause a short squeeze because of the significant negative delta posture. On the other hand, a clear break below $84,000 would make it possible for the price to drop even further, possibly to the $80,000 level or even the 200-week moving average near $57,000 if the decline lasts longer.
- Check out our free forex signals
- Follow the top economic events on FX Leaders economic calendar
- Trade better, discover more Forex Trading Strategies
- Open a FREE Trading Account
- Read our latest reviews on: Avatrade, Exness, HFM and XM
Related Articles


Sidebar rates
Related Posts
