Ethereum Hovers at $2,100 Amid Mixed Signals, Can ETH Sustain Recovery or Face Further Decline?
Ethereum is trading at about $2,100 on Tuesday, a slight 1% increase over the previous day and a 22% recovery from its Friday low of $1,750.
Quick overview
- Ethereum is currently trading at approximately $2,100, marking a 22% recovery from its recent low of $1,750, despite a previous 43% collapse.
- Technical indicators suggest that Ethereum's path to long-term recovery remains uncertain, with futures markets reflecting ongoing negative sentiment.
- On-chain data reveals increased market stress, as a surge in token transfers during price declines often signals panic-driven activity and potential capitulation.
- Short-term technical challenges and inflationary supply dynamics indicate that sustained bullish momentum for Ethereum may be unlikely in the near future.
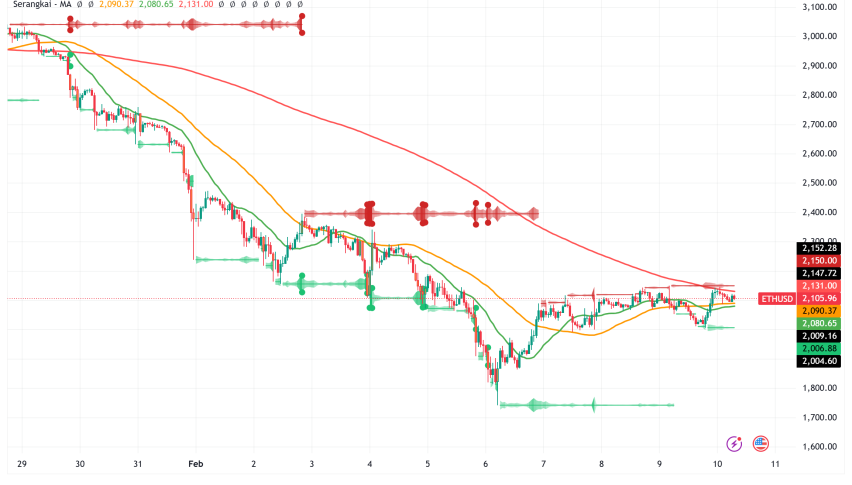
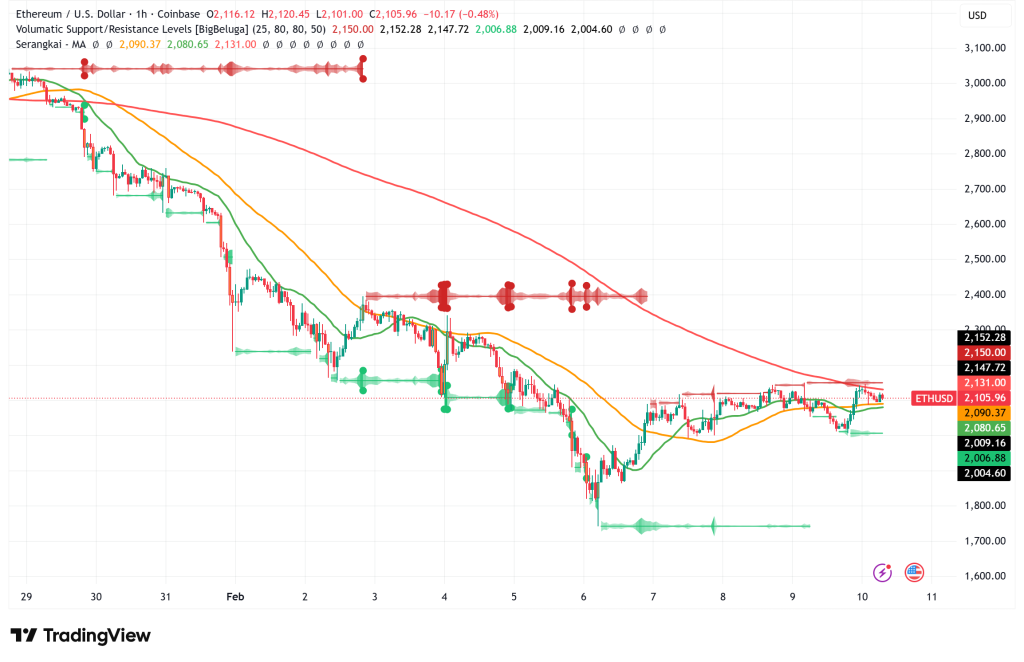
As of Tuesday, Ethereum ETH/USD is trading at about $2,100, a slight 1% increase over the previous day and a 22% recovery from its Friday low of $1,750. After a vicious 43% collapse over nine days, the second-largest cryptocurrency by market value hit its lowest price since April 2025. Technical signs and derivatives data indicate that the road to a long-term recovery is still unclear, even though the acute bleeding has stopped.
Given that ETH futures markets are still pricing in a large amount of negative risk, the relief rally seems brittle. Only a 3% premium over spot markets is being paid by monthly futures, which is far less than the 5% neutral threshold that usually denotes balanced mood. Professional traders’ enduring pessimism has persisted throughout the latest drop, failing to improve even as prices got closer to the psychologically crucial $2,000 mark.
Ethereum Fundamentals Remain Strong Despite Price Weakness
Ethereum continues to dominate important basic measures in 2026, despite a 9% year-to-date underperformance of the larger cryptocurrency market. When significant layer-2 solutions like Base, Arbitrum, and Optimism are included, the network’s base layer alone contributes for 58% of the total value locked (TVL) in the blockchain industry, which rises to over 65%.
Rivals are dwarfed by the largest decentralized application on Ethereum’s base layer, which has over $23 billion in TVL. In contrast, the biggest application on that rival network, Jupiter by Solana, wouldn’t even be among Ethereum’s top 14 protocols. Ethereum ranked third among all blockchain networks in terms of fee production over the last 30 days, with its base layer generating $19 million and its layer-2 ecosystem contributing an additional $14.6 million.
On-Chain Activity Reveals Market Stress and Potential Capitulation
There is a worrying discrepancy between market action and network activity, according to recent on-chain data from CryptoQuant. The 14-day moving average of total tokens exchanged jumped from roughly 1.6 million on January 29 to over 2.75 million by February 7, the highest amount seen since August 2025, as Ethereum corrected from around $3,000 to the $2,000 region.
Instead of organic development, this jump in ERC-20 token transfers during a price decline usually indicates increased market stress. Panic-driven repositioning, forced liquidations via DeFi protocols, and defensive portfolio adjustments as investors shift from volatile assets to stablecoins are probably the causes of the increasing activity. Such sudden increases in transfer velocity during bearish periods have historically been associated with capitulation dynamics, which may pave the way for stability after weaker hands finish their withdrawal.
ETH/USD Technical Outlook: Structural Challenges Cloud Near-Term Prospects
Technically speaking, short-term averages are crossing below longer-term ones, indicating waning momentum, and Ethereum is trading below key moving averages. A key reference mark is the 200-week moving average close to the mid-$2,000 range. Long-term trading below this level would reveal lower historical support zones and would probably confirm negative sentiment.
The fact that Ethereum’s supply has become inflationary at an annualized rate of 0.8% over the last 30 days, a sharp increase from near-zero inflation a year earlier, has further alarmed investors. The idea that ETH is a deflationary asset as a result of decreased base layer activity as customers switch to subsidized layer-2 solutions is called into question by this development.
Ethereum’s layer-2 scaling approach has proven more challenging than expected, according to Vitalik Buterin himself, who admitted on Tuesday that existing solutions rely on multisig-controlled bridges that fall short of the network’s initial security requirements. The co-founder suggested a possible long-term change in Ethereum’s development priorities: a return to base layer scalability.
Ethereum Price Prediction: Consolidation Likely Before Directional Clarity
As the market recovers from recent selling pressure, Ethereum seems likely to consolidate between $2,000 and $2,400 in the immediate future. Stabilizing momentum and possibly retaking the $3,000 mark would need regaining the $2,400–$2,600 zone. A significant decline below $2,000, however, would intensify volatility and reveal support areas in the $1,750–$1,800 range.
Sustained bullish momentum seems unlikely in the near future due to a number of factors, including weak sentiment toward derivatives, inflationary supply dynamics, persistent macroeconomic uncertainty, and the requirement for architectural changes to layer-2 techniques. A reversal in token transfer trends and higher futures premiums above the 5% neutral level are two possible indicators that accumulation is taking the place of distribution for traders.
- Check out our free forex signals
- Follow the top economic events on FX Leaders economic calendar
- Trade better, discover more Forex Trading Strategies
- Open a FREE Trading Account
- Read our latest reviews on: Avatrade, Exness, HFM and XM
Related Articles


Sidebar rates
Related Posts
