Bitcoin Struggles Under $70K Resistance: Bear Pennant and Whale Activity Signal 20% Downside Risk
BTC hovers around $67,000 amid negative funding rates, macro headwinds, and ominous on-chain signals, but a sentiment bottoming indicator
Quick overview
- Bitcoin is currently trading around $67,000, facing negative funding rates and macroeconomic pressures that weigh on market sentiment.
- Whale inflows on Binance have surged to record highs, indicating increased sell-side pressure from large holders amid a bearish chart structure.
- A bear pennant pattern has formed on the daily chart, with a potential target of $56,000 if the price breaks below key support levels.
- Despite the bearish outlook, a sentiment bottoming indicator suggests a possible shift in market dynamics, offering a glimmer of hope for bulls.
Bitcoin BTC/USD hovers around $67,000 amid negative funding rates, macro headwinds, and ominous on-chain signals, but a sentiment bottoming indicator offers bulls a glimmer of hope.
Whale Inflows Surge to Record Highs on Binance
Bitcoin’s whale inflow ratio on Binance, which calculates the percentage of exchange inflows originating from the ten largest transactions, increased to a record 0.619 (seven-day average) as of Tuesday, up from 0.40 at the beginning of the month, according to on-chain data from CryptoQuant, supporting the pessimistic argument. When paired with a failing chart structure, analysts see this as increasing sell-side pressure from large holdings, which is a historically significant warning indication.
Negative Funding Rates and Macro Pressure Weigh on Sentiment
On Monday, Bitcoin’s futures funding rate momentarily turned negative, indicating that bullish traders are not yet confident enough to employ leverage. The annualized financing rate typically ranges from 6% to 12% in a typical market; a negative value indicates a tendency toward bearish stance. With S&P 500 futures declining and tech behemoths like Nvidia, Apple, and Google facing pressure due to worries about the long-term viability of AI investments, this comes as broader risk assets experience volatility.
AI profits are unlikely to materialize in the next few years, according to Anthropic CEO Dario Amodei, who also cautioned that building data centers too quickly could prove “ruinous.” Investors have turned to gold, silver, and US government bonds as a result of this fear; 10-year Treasury yields have dropped to their lowest level since November 2025. A falling DXY index indicates that the US dollar has also depreciated, which is a mixed signal for Bitcoin, which has so far failed to capitalize despite occasionally benefiting from dollar weakness.
Bear Pennant Forms on Daily Chart, Putting $56,000 in Focus
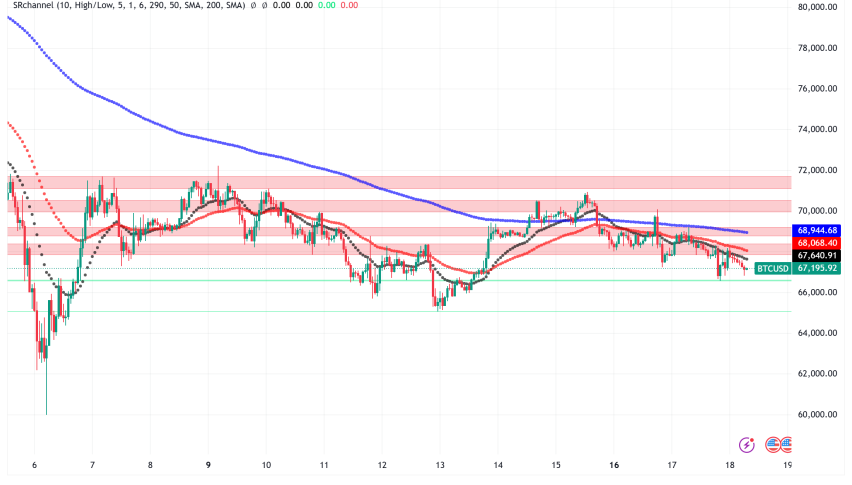
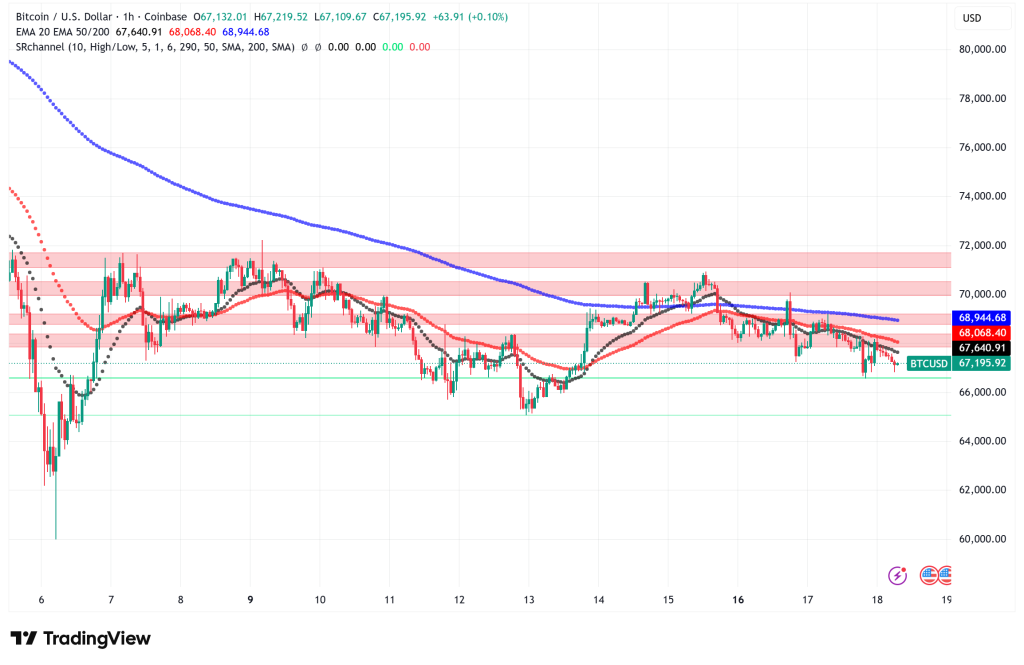
Bitcoin is currently trading around $67,000, down over 2.1% over the last day, and the technical picture is becoming more and more alarming. Bitcoin has created what analysts refer to as a classic bear pennant on the daily chart. This pattern is created when the price of the cryptocurrency consolidates between convergent trendlines after a significant sell-off, in this case the February 6 severe plummet toward the $60,200 zone.
The anticipated target is close to $56,000, which would be a 20% drop from current levels if the pattern resolves to the downside with a clear collapse below pennant support. The bearish setup would be completely invalidated if the pennant broke above its upper trendline, which is in line with the 20-day EMA close to $72,700. Bitcoin is still constricted below important moving averages as of right now, indicating poor momentum.
Key Support and Resistance Levels to Watch
The 200-week SMA at $68,300 and the 200-week EMA at $58,400, where significant BTC bottoms have historically formed, are currently where Bitcoin is positioned. Analyst Rekt Capital warns that Bitcoin might lose the 200-week EMA and experience more declines if there is no significant bullish follow-through.
The majority of traders are keeping an eye on the same crucial levels: a daily close over $71,000 would greatly strengthen the bullish argument, while a decline below $66,000 might push Bitcoin back near $60,000. According to Glassnode’s cost-basis distribution data, long-term investors recently amassed about 372,240 BTC in a notable support cluster between $63,000 and $65,000. A clear break below this area would probably pave the way for Bitcoin to reach its realized price of about $55,000, with $52,500 serving as the next significant support if $60,000 doesn’t hold.
The main positive goal if sentiment changes is the unfilled CME gap between $80,000 and $84,000, which is still acting as a magnet on the rise.
A Glimmer of Hope: Sentiment Bottoming Signal Emerges
Not every indicator is pointing downward. The 21-day moving average of Matrixport’s Greed & Fear Sentiment Index dropped below zero this week before rising, potentially signaling a bottoming indication. This combination has historically coincided with strong market bottoms, indicating that sellers might be losing ground. Even while there is still no overt bullishness, the BTC options put-to-call ratio at Deribit has normalized to 0.8x, a significant decrease from the 1.5x level observed last Wednesday.
Bitcoin Price Prediction
Bitcoin will soon have to deal with a binary setup. The larger bull case is maintained by holding over $65,000; if macro sentiment stabilizes, a recovery toward $71,000–$72,700 is feasible. A retest of $60,000 and possibly $56,000 if the bear pennant fully unfolds are the possibilities if that level is not maintained. The path of least resistance is still downward until Bitcoin registers a credible daily close above $70,000 and macro uncertainty, especially on AI investment timetables and Federal Reserve policies, starts to subside.
- Check out our free forex signals
- Follow the top economic events on FX Leaders economic calendar
- Trade better, discover more Forex Trading Strategies
- Open a FREE Trading Account
- Read our latest reviews on: Avatrade, Exness, HFM and XM
Related Articles

Sidebar rates
Related Posts
