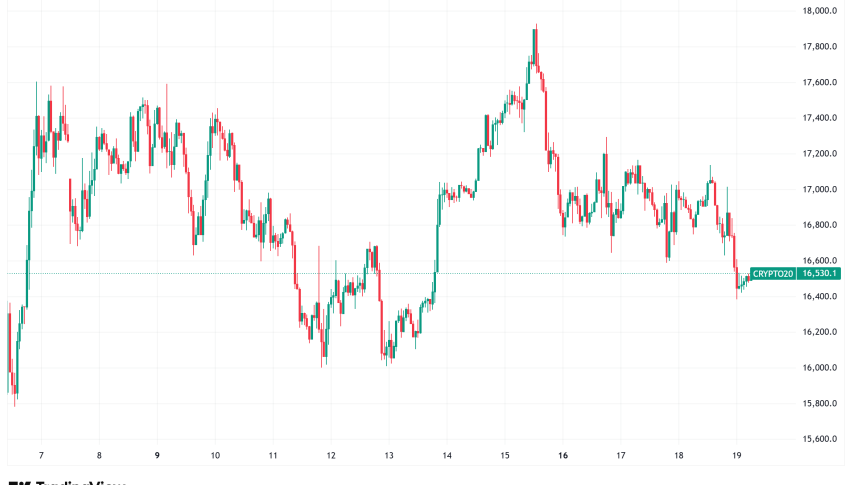
Daily Crypto Signals: Bitcoin Bottom Signal Echoes 2018, Solana Eyes $50 Support Amid Bearish Pressure
A key Bitcoin on-chain metric has hit its most extreme capitulation reading since the 2018 bear market bottom, raising hopes of a cycle low
Quick overview
- A key Bitcoin on-chain metric indicates extreme capitulation, suggesting a potential cycle low similar to the 2018 bear market.
- Solana continues to face significant downside pressure, with analysts predicting a drop to around $50 despite some positive ETF inflows.
- Riot Platforms is urged to pivot towards high-performance computing, while the European Central Bank prepares to select payment providers for its digital euro pilot.
- Short-term holder whales' realized losses remain stable, hinting at seller fatigue and potential demand from upcoming large US tax refunds.
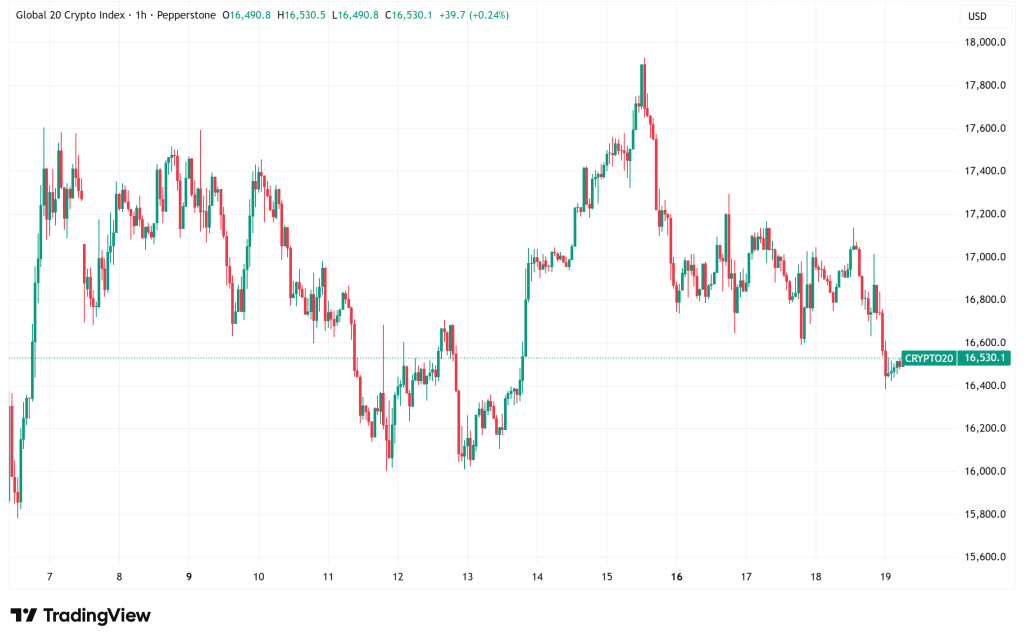
A key Bitcoin BTC/USD on-chain metric has hit its most extreme capitulation reading since the 2018 bear market bottom, raising hopes of a cycle low, while Solana SOL/USD continues to face significant downside pressure with analysts targeting $50 — even as spot ETF inflows offer a silver lining.
Crypto Market Developments
Wednesday was a busy day for the whole cryptocurrency business. Riot Platforms, a Bitcoin miner, came under fire from activist investor Starboard Value, who urged the business to expedite its shift into high-performance computing and artificial intelligence. The company claimed that its Texas data centers could unlock between $9 billion and $21 billion in equity value. With a 12-month test run planned for the second half of 2027, the European Central Bank also stated that it will start choosing EU-licensed payment service providers for its digital euro pilot as early as this quarter. The Blockchain Regulatory Certainty Act, a bill that would shield software developers and infrastructure providers from being labeled as money transmitters and protect them from federal prosecution for creating tools that don’t touch user funds, was also pushed forward by the cryptocurrency lobby group Coin Center in Washington.
Bitcoin Capitulation Signals and Institutional Ties
A signal that last surfaced at the worst of the 2018 bear market and foreshadowed a 1,900% comeback over the next three years is flashing on a well followed on-chain indicator. Bitcoin has entered its most oversold territory since late 2018, according to the Short-Term Holder (STH) Bollinger Band statistic, which gauges how far the trading price of the cryptocurrency is below the average cost basis of wallets that have held it for less than 155 days. This oscillator has typically coincided with macro cycle bottoms when it breaks through its lower statistical band. An analogous signal preceded the November 2022 bottom, which was followed by a 700% surge toward Bitcoin’s all-time high of $126,000.
The fact that short-term holder whales’ realized losses haven’t increased since Bitcoin’s October 2025 peak supports the bullish argument by indicating that bigger, more recent purchases haven’t yet panicked, which could indicate seller tiredness rather than complete surrender. In a research memo cited by CNBC, Wells Fargo strategist Ohsung Kwon provided another short-term catalyst, stating that exceptionally large US tax refunds in 2026 could direct up to $150 billion into stocks and Bitcoin by the end of March. This could provide sufficient demand to counteract any remaining sell pressure and validate a cycle bottom.
Solana Technical Breakdown and ETF Resilience
Since plunging below $67 on February 6, Solana has been under intense pressure and is still more than 72% below its peak of $295. Across several time periods, the technical picture is dismal. With a neckline breakdown around $120 and a verified head-and-shoulders pattern on the weekly chart, SOL is indicating a measured downside target of about $57. SOL is holding onto support close to $80, which is a bear flag’s lower border, on the daily chart. The pattern would be confirmed and a further decrease toward $48, or around 41% below current levels, would be possible if the daily close fell below that level. The $50–$60 range has been widely accepted by analysts as the next significant area of support.
However, there are grounds to believe that the worst is almost over. The lowest support barrier is located close to $73, according to Solana’s MVRV extreme deviation pricing bands, which indicate when SOL is trading below the average price at which holders last transferred their coins. SOL has already experienced notable rallies following touches or brief breaches of this area, including an 87% recovery in March 2022. Since their October 2025 inception, US-based spot Solana ETFs have seen inflows on 66 out of 74 trading days. Tuesday’s inflows were $2.9 million, bringing the total to $877 million. Even during a significant price decline, the institutional appetite remained strong, indicating structural demand that might help stop SOL’s decline.
- Check out our free forex signals
- Follow the top economic events on FX Leaders economic calendar
- Trade better, discover more Forex Trading Strategies
- Open a FREE Trading Account
- Read our latest reviews on: Avatrade, Exness, HFM and XM
Related Articles

Sidebar rates
Related Posts
