Bitcoin Holds $71K Lifeline as U.S. Naval Blockade of Strait of Hormuz Sends Oil to $105
Before things drastically worsened, Bitcoin had been gaining pace, rising about 5.8% from April 6 to momentarily surpass $73,000. In direct
Quick overview
- Bitcoin briefly surpassed $73,000 before declining to around $71,221 due to geopolitical tensions following President Trump's blockade announcement in the Strait of Hormuz.
- The blockade has caused a significant spike in oil prices and raised concerns about stagflation, leading to a bearish outlook for Bitcoin as a risky asset.
- Key support for Bitcoin is at $70,000, with potential downside to $67,000 if negative news persists, while a weekly close above $71,000 could signal a move towards resistance.
- Upcoming regulatory discussions on the CLARITY Act may provide a positive catalyst for the cryptocurrency market amidst prevailing macroeconomic pressures.
Before things drastically worsened, Bitcoin BTC/USD had been gaining pace, rising about 5.8% from April 6 to momentarily surpass $73,000. In direct response to the collapse of peace talks over Iran’s nuclear program, President Trump declared on Truth Social on Saturday that U.S. navy forces would blockade the Strait of Hormuz and interdict any vessel that has paid Iran a toll.
Blockade Shock: How Geopolitics Broke the BTC Rally
About one-fifth of the world’s oil commerce passes via the Strait of Hormuz. Brent crude saw its biggest single-session increase since Russia’s invasion of Ukraine in 2022, rising 9.5% to $105 per barrel in just 30 minutes after U.S. futures markets opened on Sunday. Together, Bitcoin fell to a session low of $70,623, momentarily endangering a crucial support area before leveling out above $71,000, where it is currently trading down 0.62% for the day at $71,221.
Short-term traders are viewing Bitcoin as a risky asset despite its long-term reputation as a macro hedge. The blockade is a real supply shock to the world’s energy markets, stoking concerns about stagflation and reducing demand for speculative assets in general.
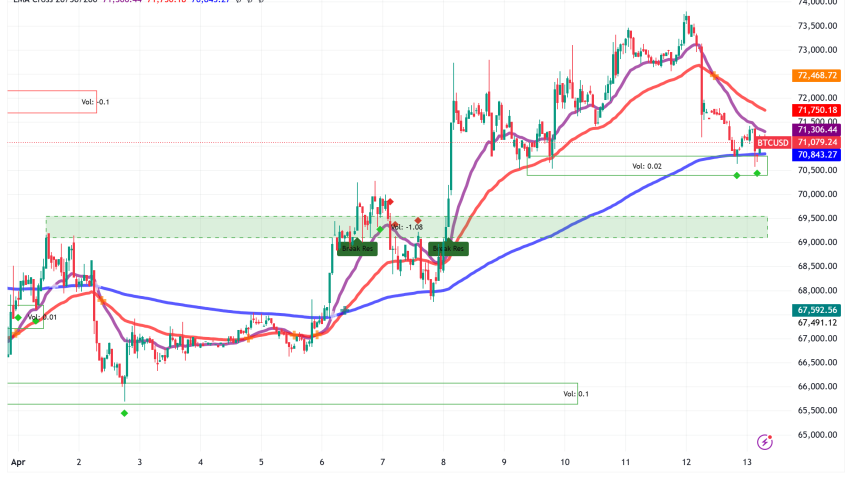
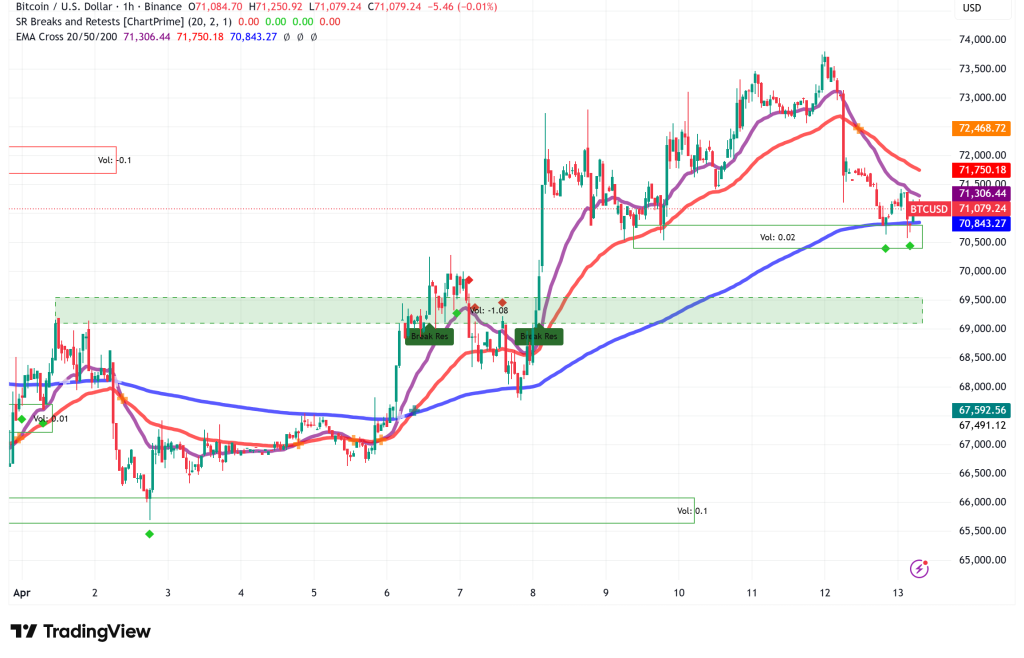
BTC/USD Technical Picture: $70,000 Is the Line in the Sand
The fact that Bitcoin is still trading below its 200-day exponential moving average indicates a bearish structural signal. According to Coin Bureau analyst Nic Puckrin, the key near-term support is $70,000, while the immediate resistance band is between $73,000 and $74,000. It would be beneficial to have a weekly closing over $71,000 since it might start a crawl toward that resistance band.
The next significant floor below $70,000 is approximately $67,000, which is close to the March panic bottom. If international news continues to worsen, this level may be tested soon. Low-conviction dips and rebounds are typical in this type of news-driven environment, therefore volume confirmation on any directional move will be crucial.
Rate Cut Hopes Evaporate as Macro Headwinds Mount
Expectations of a short-term Federal Reserve rate drop have been effectively abandoned due to the inflationary effects of the Hormuz blockade. There is a greater than 98% chance that the FOMC will maintain rates at its meetings on April 29 and June 17, according to CME FedWatch. The July 29 meeting is currently the earliest feasible window for a 25-basis-point drop, and even then, the likelihood is at 33.6%. If inflation stays above the 2% objective, FOMC members have not ruled out raising interest rates, which would be extremely detrimental to riskier assets like Bitcoin.
ETF flows continue to be net positive week over week, somewhat countering this pressure and indicating that institutional accumulation is still going on under the surface even as retail sentiment declines.
Regulatory Wildcard: The SEC’s CLARITY Act Roundtable
The SEC will have a roundtable on the CLARITY Act on April 16. This could be a spark that is completely unrelated to the Middle East crisis. In a market that might otherwise be dominated by macro concern, positive regulatory signals could offer a floor and introduce new hope. As a possible short-term re-rating catalyst for the larger cryptocurrency market, traders should keep a close eye on this development.
Bitcoin Price Prediction: Three Scenarios to Model
A ceasefire that ends the geopolitical overhang, oil sliding down below $80 per barrel, and softer-than-expected economic statistics to allay fears of stagflation are all necessary for a prolonged recovery, according to Puckrin’s clear framework. Today, none of those circumstances exist.
BTC grinds sideways in the $70,000–$74,000 region for the majority of Q2 in the base case, which is a stalemate with no further escalation. The bull case aims at $90,000 and requires all three of the aforementioned parameters. A breach below $70,000 initiates the bear case, which aims to reach the March low around $67,000. If sentiment dramatically declines, momentum may continue.
- Check out our free forex signals
- Follow the top economic events on FX Leaders economic calendar
- Trade better, discover more Forex Trading Strategies
- Open a FREE Trading Account
- Read our latest reviews on: Avatrade, Exness, HFM and XM
Related Articles


Sidebar rates
Related Posts
