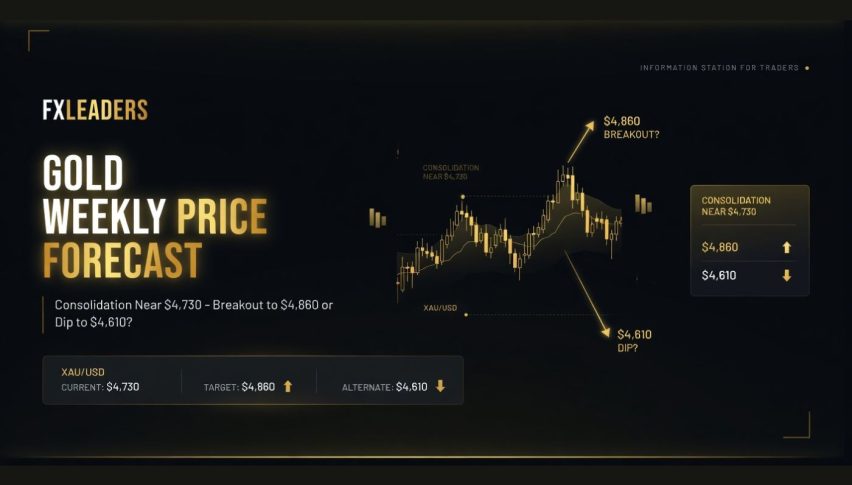
Gold Weekly Price Forecast: Consolidation Near $4,730 – Breakout to $4,860 or Dip to $4,610?
Gold is currently trading in a pretty tight range of $4,700 to $4,750 per ounce as of the 12-13 of April 2026: its been a bit...
Quick overview
- Gold is currently trading in a tight range of $4,700 to $4,750 per ounce, following fluctuations influenced by profit-taking and cautious sentiment.
- The upcoming week is expected to bring significant volatility due to key US economic data releases and geopolitical updates, particularly regarding the US/Iran ceasefire.
- Gold's technical outlook shows stabilization above a key demand zone, with potential for a bullish trend if it remains above $4,700.
- Market sentiment is sensitive to macroeconomic headlines, making the next week crucial for determining gold's trajectory for the rest of the year.
Gold is currently trading in a pretty tight range of $4,700 to $4,750 per ounce as of the 12-13 of April 2026: its been a bit of a rollercoaster ride after closing the previous week at an average of $4,749 to $4,751. More recently we’ve seen the price fluctuate anywhere between $4,704 and $4,791, with some pretty big intraday dips that look like they might have been caused by people taking profits and just generally being a bit cautious.
The price has backed off a bit from the highs we saw earlier in the week (around $4,800+ when the ceasefire was looking more promising) but it’s still holding up pretty well within a larger bullish trend that we’re still seeing for 2026 overall. Over the course of the year so far, gold has had some pretty wild swings, with prices bouncing up over $5,000-$5,500 a few months ago, before then coming back down a bit because of some changes in the geopolitical situation.
Key Drivers This Week
The week ahead (April 13-19) is going to be pretty eventful, with a lot of data releases and other things that could drive a lot of volatility in gold – think a lot of potential for big price swings:
- US Economic Data: We’re expecting a few big releases, including PPI (14th of April), retail sales, and some comments from the Fed. If we get some hotter-than-expected inflation we might expect the price of gold to fall (because that would look like a cue for the Fed to keep raising interest rates, which isn’t great for gold), but if we see some softer data that might revive hopes that the Fed will start to cut interest rates again (which is good news for gold).
- Geopolitical Updates: The US/Iran ceasefire is still a big focus, as are the talks over in Islamabad, Pakistan. Any signs of problems, delays, or renewed hostilities could send safe-haven demand for gold through the roof – but if things do go well and we start to see some progress, that looks like it could support a bit of a risk-on sentiment and cap gold’s gains.
- Central Bank & Institutional Flows: We’re keeping an eye on the central banks – especially in China and emerging markets – to see how much they’re buying, and also looking at the inflows of ETFs. We’ve seen some pretty robust purchases in February, with 95% of the central banks we’re looking at planning on increasing their gold holdings in 2026.
- Broader Sentiment: We’ll be keeping an eye on the US dollar, Treasury yields, and equity markets – because if we see a weak US dollar, falling yields, or a downtrend in the equities, that’s typically good news for gold.
Gold (XAU/USD) Technical Outlook for the Week
Right now, gold is kind of stabilising after a sharp recovery, currently trading at $4,726 and respecting a rising trendline, and then also holding above a key demand zone near $4,700-$4,730. This is pretty much the same area we’ve been seeing a lot of consolidation and trading around lately – and it looks like it could be the price’s next pivot point.
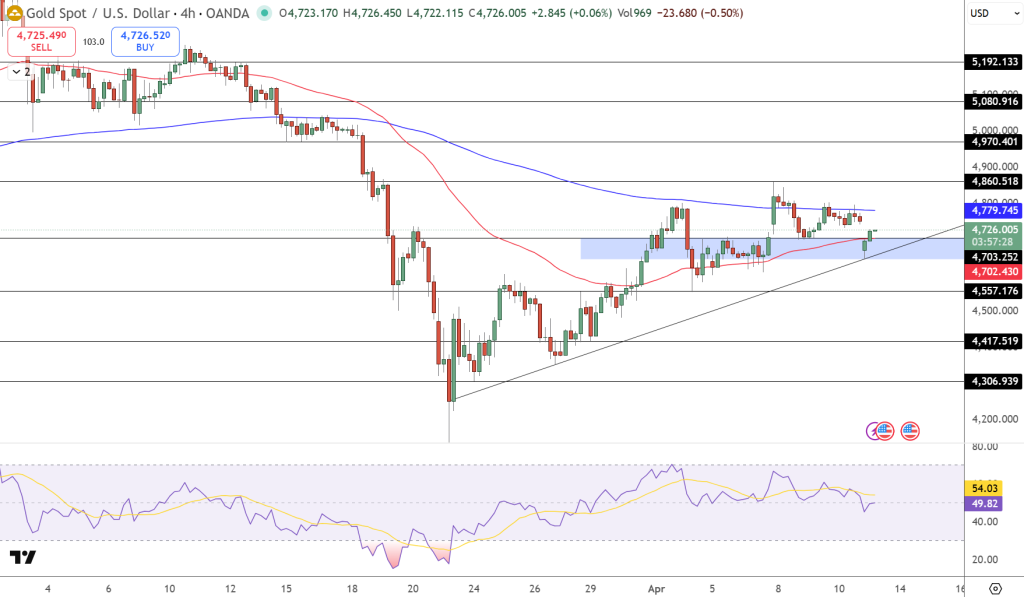
Price action is telling us that we’ve got higher lows, which is a pretty good sign that the overall trend is still looking bullish. The 50 EMA is now flattening and starting to turn upwards, but the 200 EMA near $4,780 is still a pretty major resistance level that’s holding back the price for now.
In terms of candlestick patterns, they’re looking pretty indecisive, with some smaller-bodied candles forming near support, which looks like the market might be accumulating some positions rather than just selling off. Our RSI is hovering around 50, which suggests we’re not really seeing any kind of strong bias in either direction just yet.
Weekly Bias: If we can stay above $4,700, we’re looking at a bit of a bull run up towards $4,780 and $4,860 – but if we do fall below $4,700, that could expose us to a drop down to $4,557 and reverse our short-term outlook.
One thing we do know is that gold is extremely sensitive to any kind of real-time headlines or macro data – and the next week is going to be crucial in setting the tone for the rest of the year. We’ll just have to see what happens with the ceasefire and US inflation signals
- Check out our free forex signals
- Follow the top economic events on FX Leaders economic calendar
- Trade better, discover more Forex Trading Strategies
- Open a FREE Trading Account
- Read our latest reviews on: Avatrade, Exness, HFM and XM
Related Articles


Sidebar rates
Related Posts
