

 <% (signals.list.current.rate).substr(0,7) %>


 <% signal.analyst %>
<% signal.analyst %>
<% signal.analyst %>

Last Updated: Feb 23, 2026 03:11:01 PM (GMT)
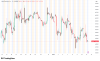
META: The current market price is 655.89, representing a 0.00% change from the previous close.
Support and Resistance Levels Support levels are 640.00, 639.00, and 638.00. Resistance levels are 660.00, 661.00, and 662.00, with a pivot point at 645.00.
Indicators The RSI is 68.57, indicating overbought conditions. The ATR shows volatility at 1.568. The ADX is 52.181, suggesting a strong trend. The 50-day SMA is 655.89, and the 200-day EMA stands at 649.44, indicating the trend's upward strength.
Market Sentiment Currently above the pivot point at 645.00, a bullish trend is confirmed by supportive indicators, favoring buying opportunities.
META Signals & Technical Analysis
Market Sentiment
Trend Indicators
Oscillators
Moving Averages
Pivot
About (META) Meta Platforms, Inc.
Company Background
Meta Platforms, Inc., traded under the stock symbol META on the NASDAQ exchange, is a leading American technology company that specializes in social media and virtual reality. Originally founded in 2004 as Facebook, Inc., the company rebranded to Meta in 2021 to reflect its commitment to building the metaverse—a collective virtual space that will reshape social interactions and digital experiences. Headquartered in Menlo Park, California, Meta operates several key platforms, including Facebook, Instagram, WhatsApp, and Oculus, serving billions of users worldwide.Market Position
As a dominant player in the social media landscape, Meta Platforms holds a significant market position with a vast user base. As of 2023, Facebook boasts over 2.9 billion monthly active users, making it one of the most popular social networking platforms globally. Instagram and WhatsApp also contribute significantly to the company's reach, enhancing Meta's ecosystem and advertising capabilities. The company continually innovates by investing in new technologies and incorporating features that cater to evolving user needs, thereby solidifying its status as a leader in digital communications.Key Financial Highlights
Meta Platforms, Inc. has demonstrated robust financial performance, with a notable revenue growth trajectory fueled by its extensive advertising business. In 2022, the company reported revenue exceeding $116 billion, driven by a diverse portfolio of ad placements across its platforms. The company continues to invest heavily in research and development, with significant expenditures directed towards enhancing its virtual and augmented reality capabilities. As of the third quarter of 2023, Meta maintains a strong balance sheet, showcasing substantial market capitalization and a healthy cash flow, making it a preferred choice for investors seeking exposure to the tech sector.Industry Outlook
The future of Meta Platforms, Inc. is aligned with the burgeoning developments in the metaverse, where the company is focusing its efforts on creating immersive digital environments. With increasing demand for virtual interactions, gaming, and augmented reality experiences, Meta is well-positioned to capitalize on these trends. As technology continues to evolve, Meta's strategic initiatives are aimed at enhancing user engagement and driving sustainable growth, reinforcing its pivotal role in shaping the future of digital communication.META has this year gone up by 50%. This is despite a tough 2022 and indicates it s a good time to consider the Facebook stock as a buy. However, note that the significant gains could be the result of the company's sharp drop in 2022. The aftermath rebound shows that the stock is on time this year to grow and pay off investors.
The general outlook for META is somewhat stagnant due to lagging advancement across VR/AR technologies. META seems highly invested in building the Metaverse, and could significantly rely on the mentioned technologies. While there seems to be an upward rebound trajectory, this is not enough information to conclude a bullish prediction. Again, it's not fair to dismiss the stock as bearish given its endurance through the tough 2022.
META's stock is influenced by both tech-industry force and company perfomance. In 2022, the tech industry slumped, however, META witnessed its stock fall below the tech-heavy NASDAQ 100 index. Advancement across the VR/AR industry is also likely to affect the price of Facebook stocks.
Related Stocks


Sidebar rates
- <% signal.pair %>
<% signals.active.Current.rate.substr(0,7) %>