


 <% (signals.list.current.rate).substr(0,9) %>
 <% signal.analyst %>
<% signal.analyst %>
<% signal.analyst %>

Last Updated: Feb 23, 2026 03:33:20 PM (GMT)
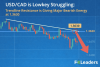
USD/CAD: The current market price is 1.36900, up 0.02% from the previous close.
Support and Resistance Levels Support levels are at 1.36700, 1.36600, and 1.36500, while resistance levels are at 1.37000, 1.37100, and 1.37200. The pivot point is 1.36850.
Indicators The RSI is at 54.27, indicating a neutral trend. The ATR is at 0.0016 showing low volatility. The ADX is at 17.22, suggesting a weak trend. The 50-day SMA is at 1.36874, and the 200-day EMA is at 1.36824, indicating consolidation. The Parabolic SAR points at 1.36826, indicating a bullish sentiment.
Market Sentiment The market price is above the pivot point (1.36850) and indicators suggest a bullish scenario.
USD/CAD Signals & Technical Analysis
Market Sentiment
Trend Indicators
Oscillators
Moving Averages
Pivot
Informazioni su USD/CAD (U.S. Dollar/Canadian Dollar)
La coppia di valute Dollaro statunitense / Canada indica il tasso di cambio tra il dollaro USA e il dollaro canadese ed lo esprime come il numero di dollari canadesi necessari per acquistare un dollaro USA. La coppia di valute USD / CAD è una coppia di valute indirette ed è soprannominata Loonie.
L'USD / CAD è anche classificata come coppia di materie prime, in quanto presenta una correlazione con i prodotti energetici greggio e gas naturale. Il valore di USD / CAD è fortemente legato alle relazioni commerciali tra Canada e Stati Uniti. La geografia promuove il libero scambio tra le due nazioni e sono politicamente cooperanti tra loro.
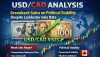
Analisi di "USD / CAD"
Il dollaro canadese è la settima valuta più scambiata al mondo e alcune banche centrali lo tengono come valuta di riserva. Il tasso di cambio USD / CAD in relazione al biglietto verde e alle altre valute principali è fortemente influenzato dai prezzi del greggio.
Questo perché il Canada ha vaste riserve di petrolio - seconda solo all'Arabia Saudita - ed è un produttore vitale della merce, con il 99% delle sue esportazioni di petrolio greggio spedite negli Stati Uniti. Secondo una stima, oltre due milioni di barili di petrolio viaggiano ogni giorno dal Canada al suo vicino meridionale.
Il prezzo del petrolio, quindi, funge da indicatore principale per il movimento della coppia USD / CAD. Quando i prezzi del petrolio aumentano, l'USD / CAD diminuisce perché il valore del dollaro canadese si apprezza.
Inoltre, la salute economica generale degli Stati Uniti ha un impatto significativo sulla coppia e gli interventi sul mercato da parte della Federal Reserve influenzeranno il valore di entrambe le valute.
La forza dell'economia canadese ha visto il Loonie salire bruscamente contro il biglietto verde nel settembre 2007, chiudendo al di sopra del dollaro USA nelle negoziazioni per la prima volta in 30 anni.
Ha continuato a raggiungere il massimo record di US $ 1,1024 a novembre e nel 2007 è stato nominato Canadian Newsmaker of the Year by Time.
Correlazioni valutarie
Il dollaro canadese è fortemente correlato al valore delle materie prime, in particolare il greggio WTI. Come abbiamo detto in precedenza, l'economia canadese dipende fortemente dal greggio e il prezzo del petrolio orienta la salute dell'economia.
Nel 2016, quando i prezzi del petrolio sono scesi ai minimi decennali, scambiando meno di $ 30 al barile, il dollaro canadese ha registrato un minimo record, scambiando a $ 1,46, il che implica che ha richiesto 1,46 dollari canadesi per acquistare 1 dollaro USA.
Inoltre, l'USD / CAD condivide una correlazione negativa con le coppie di valute AUD / USD, GBP / USD e NZD / USD in quanto quotate in dollari USA.
Cosa determina il tasso di cambio USD / CAD?
Numerosi fattori possono influire sulla valutazione USD / CAD, tra cui:
Politiche monetarie BOC e US FED: la Bank of Canada e la Federal Reserve controllano l'offerta di denaro sul mercato, per mantenere l'economia sulla buona strada. Una politica dovish, nota anche come politica espansiva, indebolisce la valuta. Al contrario, una politica monetaria da falco (politica contrazionale) rafforza la valuta.
Eventi economici: qualsiasi movimento negli eventi economici negli Stati Uniti e in Canada determina i tassi di cambio. I principali eventi economici includono PIL, cambiamento dell'occupazione, produzione industriale e indice dei prezzi al consumo. I dati migliori delle previsioni aumentano la domanda per la valuta correlata e incidono sul valore di Loonie o del dollaro USA, causando fluttuazioni del tasso di cambio USD / CAD.
Petrolio greggio: in genere, il prezzo del petrolio greggio è stato fortemente correlato con USD / CAD. Pertanto, un aumento dei prezzi del greggio aumenta il valore del dollaro canadese e viceversa.
Principali eventi economici:
Prodotto interno lordo: il prodotto interno lordo è la misura centrale della crescita economica nella regione.
Indice dei prezzi al consumo – Poiché uno degli obiettivi del BOC è mantenere la stabilità dei prezzi, tengono d'occhio gli indicatori dell'inflazione come l'IPC. Se l'IPC annuale si discosta dall'obiettivo della banca centrale, il BOC potrebbe utilizzare i suoi strumenti di politica monetaria per tenere sotto controllo l'inflazione.
Bilancia commerciale – L'economia canadese è considerata un'economia basata sulle risorse ed è fortemente dipendente dalle esportazioni. Il calo del numero delle esportazioni potrebbe portare a un declino dell'attività economica.
Indice dei gestori degli acquisti (PMI) di Ivey – Il PMI è un sondaggio progettato per vedere se le aziende sono ottimiste o pessimiste sull'economia. Una lettura al di sopra della baseline 50.0 indica che le condizioni nel settore aziendale stanno crescendo mentre una lettura al di sotto di 50.0 indica diversamente.
Specifiche USD / CAD
L'USD / CAD è negoziato in importi denominati in dollari canadesi. Dimensione lotto standard: 100.000 Dimensione lotto mini: 10.000 Un pip in decimali 0,0001 Valore pip: $ 10 (varia con il tasso di cambio)
Formula
Utile / perdita = (Prezzo di offerta - Prezzo richiesto) X Dimensione del contratto X Numero di lotti / Prezzo di chiusura
Sidebar rates
- <% signal.pair %>
<% signals.active.Current.rate.substr(0,7) %>