WTI Crude Oil Completes 50% Retracement – What’s Next?
In the European trading session, the WTI Crude Oil edged lower, giving us another trading opportunity. Our forex trading signal on the black gold closed at take profit level of $46.45.
Forex Trading Signal
At this point, I'm looking for a second entry in the crude oil. But, the trend is unclear. However, the rough idea is to stay in selling below $46.35 with a stop loss below $45.90 and $45.75 along with a stop loss of $46.55
2 Reasons For A Bearish Trade
First – Over the previous week, the inventory figures from the Energy Information Administration (EIA) showed a draw of 0.93 million barrels, which was not in line with the expectation of 2.2 million. As we know, a smaller than expected drop in inventories represents less demand for the crude oil over the previous week.
In Nov 2016, the OPEC and Non-OPEC members decided to cut the output from January to June to support the falling oil prices but practically things are not working out for them. These OPEC and Non-OPEC countries are likely to meet again on May 25 to decide if they need to extend the supply cut deal.
 Crude Oil – 50% Fibonacci Retracement Chart
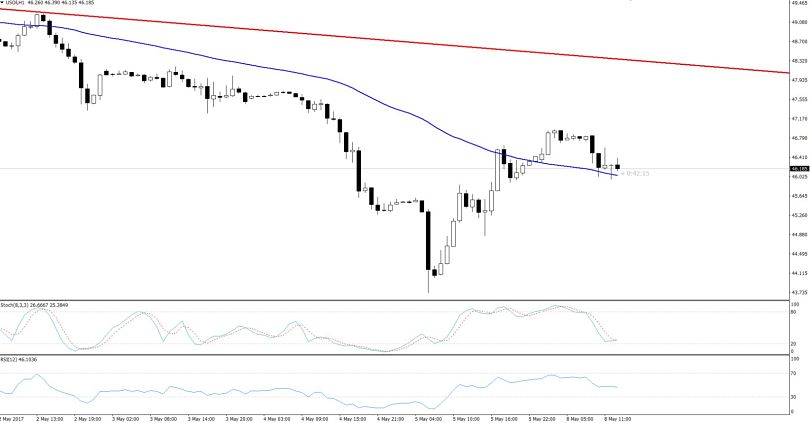
Second – On the 4- hour chart, the crude oil has completed the 50% Fibonacci retracement at $47 and held below this level before I shared a call to sell.
At the moment, it's still holding above a strong support level of $45.95 which is extended by the 50 periods EMA on the hourly chart. Let's wait for the New York session as we may have an opportunity with the new wave of investors.
- Check out our free forex signals
- Follow the top economic events on FX Leaders economic calendar
- Trade better, discover more Forex Trading Strategies
- Open a FREE Trading Account
- Read our latest reviews on: Avatrade, Exness, HFM and XM
Related Articles


Sidebar rates
Related Posts
