Jan 10 – Top Economic Events & Trade Setups
Yesterday, we made some nice profits in Gold. However, the latest sentiments about the BOJ monetary tightening strengthened the safe haven..
Welcome back, guys. Yesterday, we made some nice profits in Gold. However, the latest sentiments about the BOJ monetary tightening strengthened the safe haven currency to knock us out of the trade. These are the events to watch today:
Today’s Top Economic Events
Great Britain Pound – GBP
Manufacturing Production m/m – The indicator will be released at 9:30 (GMT) by the Office for National Statistics with a forecast of 0.3% vs. 0.1%.
This is a leading indicator of economic health. The production reacts quickly to ups and downs in the business cycle and is correlated with consumer conditions such as employment levels and earnings. Therefore, the greater number will support the Cable today.
Goods Trade Balance – The UK trade balance will be worth monitoring. It shows the difference in value between imported and exported goods during the reported month.
Canadain Dollar- CAD
Building Permits m/m – The Statistics Canada will release the building permits. It’s an excellent gauge of future construction activity because obtaining a permit is among the first steps in constructing a new building. Logically, we only invest in capital assets when the economic activities are on track. But the figure is expected to drop by -0.7% vs. 3.5% in Dec.
Today’s Top Trade Setups
EUR/USD – Get Ready To Catch Retracement
As we spoke about in our Jan 9 – Morning Brief, the Euro fell another 70 pips to hit our target level of $1.1935.
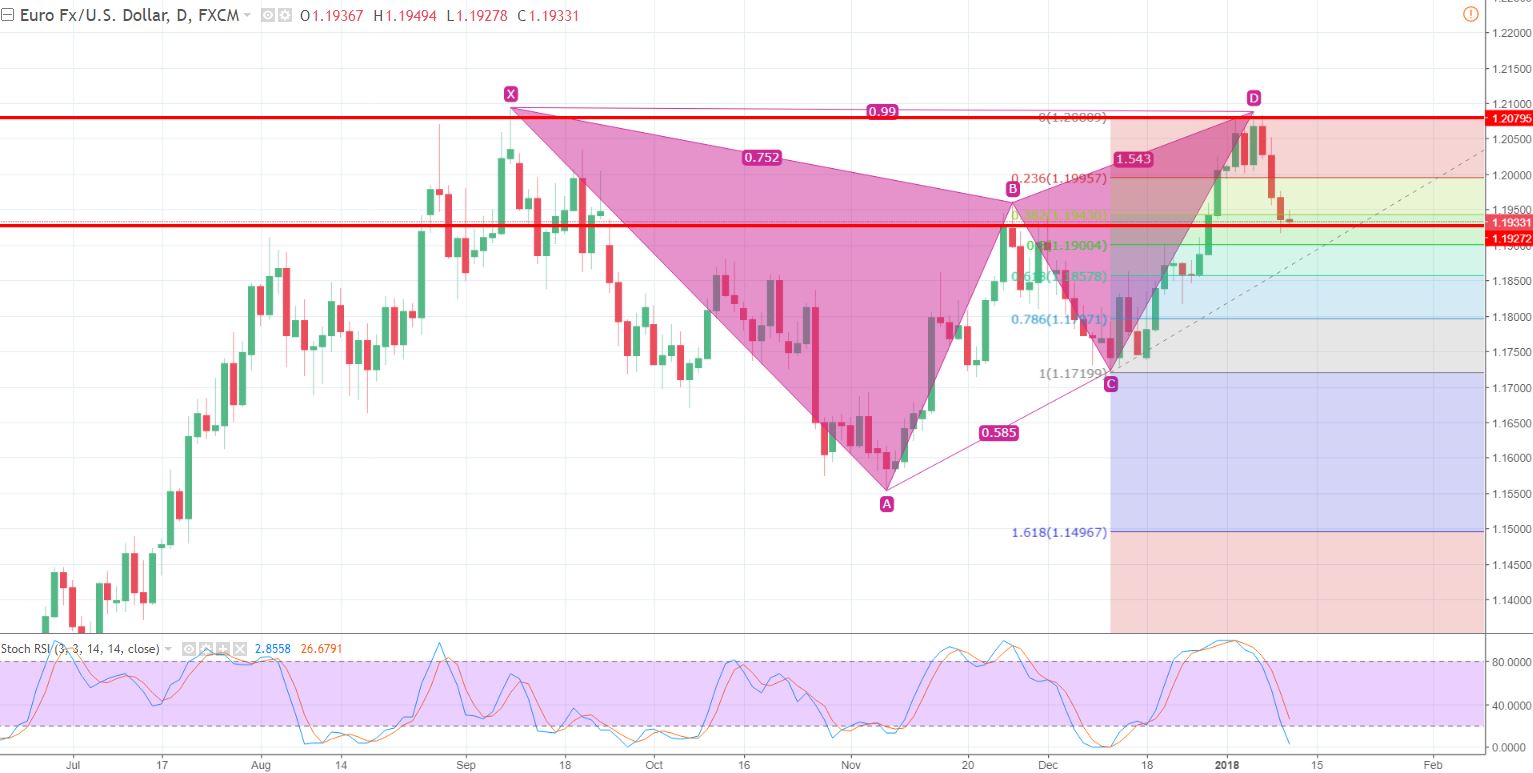
EUR/USD – Daily Charts
For now, the pair is likely to bounce off the immediate support $1.1900. A break below this level will lead the pair towards $1.1875.
EUR/USD – Key Trading Levels
Support Resistance
1.1908 1.1968
1.1882 1.2002
1.1848 1.2028
Key Trading Level: 1.1942
EUR/USD Trade Plan
Traders, we need to stay bearish below $1.1945 to target $1.1905 and $1.1875. A the break above $1.1950 will give us buying opportunity until $1.1980.
USD/JPY – Trade The Tripple Bottom
On the 3 – hour chart, the USD/JPY pair is likely to form a triple bottom pattern. The pair has already tested $112.120 twice and is now heading to test it for the third time. The leading indicators in the oversold regions are supporting the bullish sentiment. We can expect a bullish retracement up to $112.600 today.
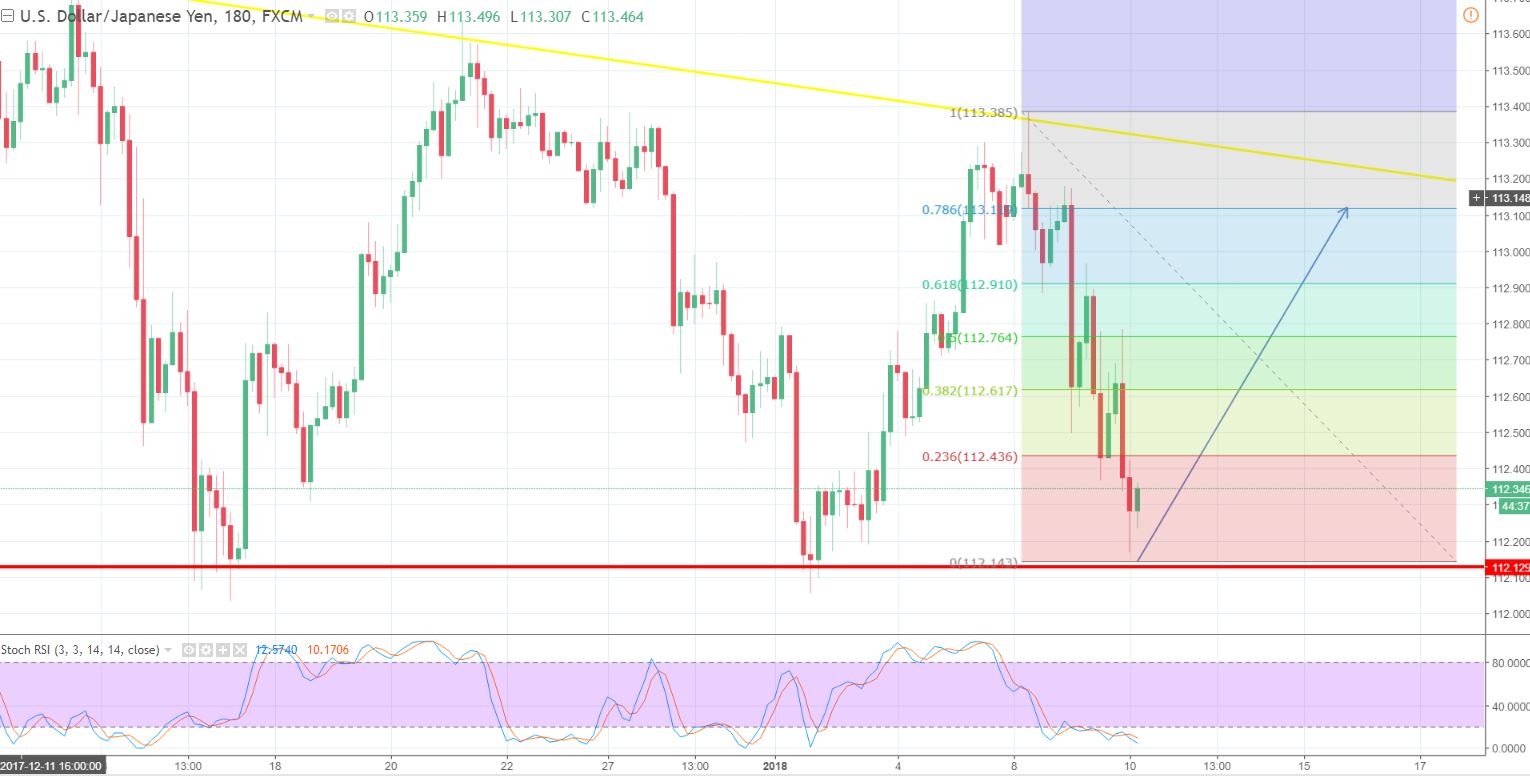
USD/JPY – 180 – Mins Chart
USD/JPY – Key Trading Levels
Support Resistance
112.28 113.09
111.91 113.53
111.47 113.9
Key Trading Level: 112.72
USD/JPY Trade Plan
The idea is to stay bullish above $112.100 with a stop below $111.850 and a take profit of 112.750. Good luck
- Check out our free forex signals
- Follow the top economic events on FX Leaders economic calendar
- Trade better, discover more Forex Trading Strategies
- Open a FREE Trading Account
- Read our latest reviews on: Avatrade, Exness, HFM and XM
Related Articles


Sidebar rates
Related Posts
