WTI crude oil peaking out of sideways channel – EIA report plays well!
Earlier today, crude oil prices soared, extending gains on mounting evidence of interruptions to crude supply from Iran and Venezuela....
•
Last updated: Thursday, August 30, 2018
Earlier today, crude oil prices soared, extending gains on mounting evidence of interruptions to crude supply from Iran and Venezuela and after a drop in U.S. crude inventories. The demand for crude oil got another boost after the EIA (Energy Information Administration) reported a draw -2.6M barrels while the economists only expected a draw of -0.7M barrels.
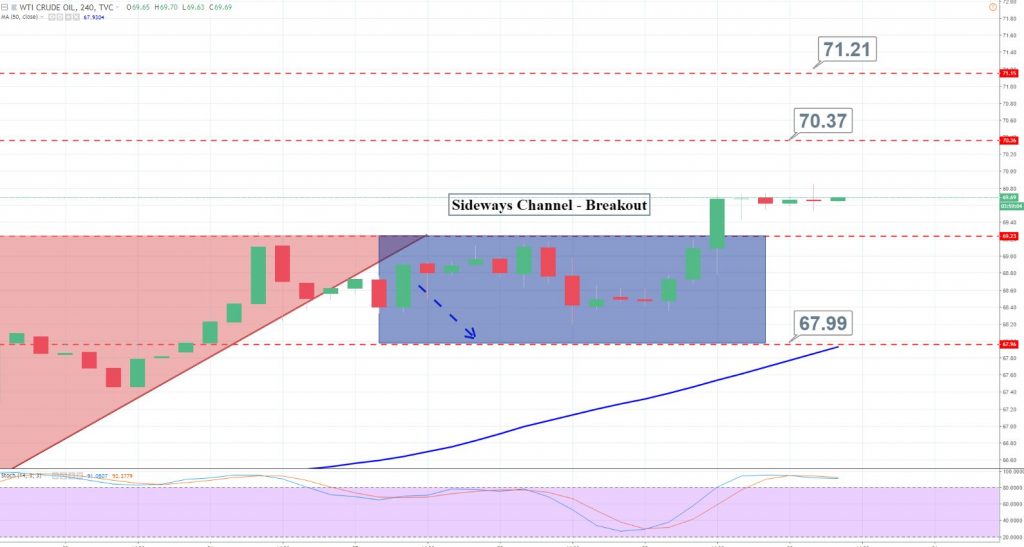
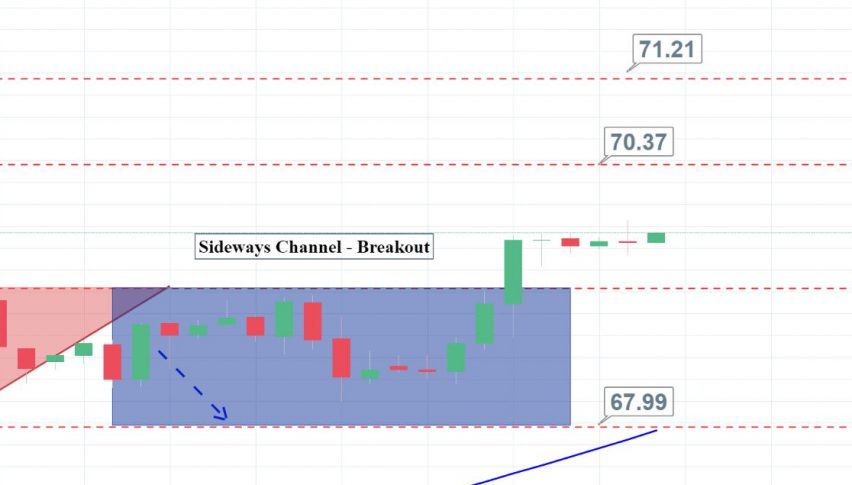
I was looking at the crude oil chart, and there hasn’t been much movement in the market. The month of Aug is just like that. Anyhow, crude oil has emerged from the narrow trading range of $68-$69.25 to close the number of neutral candles outside the range. This opens a potential for bullish opportunities until $70.35 and $71.20. Stay tuned for updates!
- Check out our free forex signals
- Follow the top economic events on FX Leaders economic calendar
- Trade better, discover more Forex Trading Strategies
- Open a FREE Trading Account
- Read our latest reviews on: Avatrade, Exness, HFM and XM
ABOUT THE AUTHOR
See More
Arslan Butt
Lead Markets Analyst – Multi-Asset (FX, Commodities, Crypto)
Arslan Butt serves as the Lead Commodities and Indices Analyst, bringing a wealth of expertise to the field. With an MBA in Behavioral Finance and active progress towards a Ph.D., Arslan possesses a deep understanding of market dynamics.
His professional journey includes a significant role as a senior analyst at a leading brokerage firm, complementing his extensive experience as a market analyst and day trader. Adept in educating others, Arslan has a commendable track record as an instructor and public speaker.
His incisive analyses, particularly within the realms of cryptocurrency and forex markets, are showcased across esteemed financial publications such as ForexCrunch, InsideBitcoins, and EconomyWatch, solidifying his reputation in the financial community.
Related Articles


Sidebar rates
Related Posts
