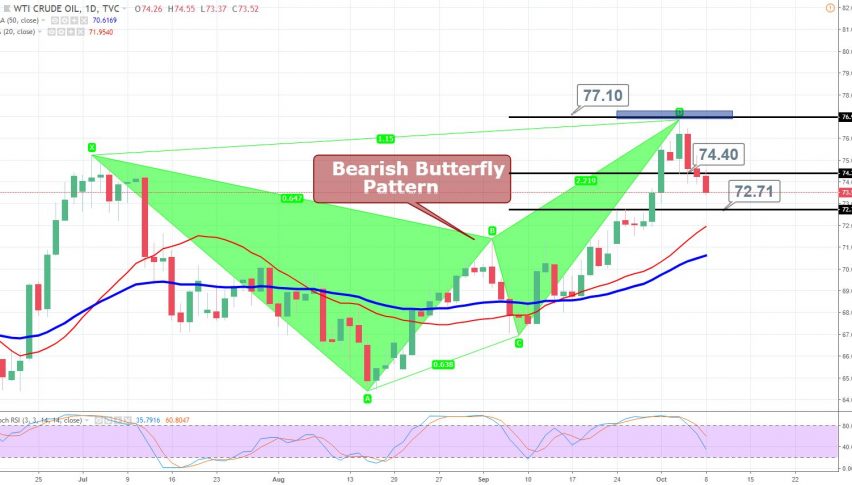
WTI Crude Oil Take a Dip – Bearish Butterfly Does Well!
The WTI Crude Oil has completed the C to D wave near $77.10. Earlier It violated the immediate support level of $74.40 on Friday and the...
What’s up, traders.
The WTI black crack plunged more 250 pips in three days to trade below $74. This probably came in response to a dramatic build in inventories. During the previous week, the Energy Information Administration (EIA) reported a build of 8 million barrels of stocks, which is dramatically higher than the economists’ forecast of 1.1 million barrels. Initially, crude oil dipped but recovered the losses amid the imminent return of U.S. sanctions on Iran.

Support Resistance
73.68 74.99
73.11 75.73
71.8 77.04
Key Trading Level: 74.42
Moreover, the bearish butterfly pattern on the daily chart is also attracting sellers. The pattern completed the C to D wave near $77.10. It violated the immediate support level of $74.40 on Friday and the bearish trend still seems dominant. The next support prevails at $72.75.
I will be looking to take a buying position somewhere around $72.75. Good luck and stay tuned to FX Leaders for more updates!
- Check out our free forex signals
- Follow the top economic events on FX Leaders economic calendar
- Trade better, discover more Forex Trading Strategies
- Open a FREE Trading Account
- Read our latest reviews on: Avatrade, Exness, HFM and XM
Related Articles


Sidebar rates
Related Posts
