U.S. Jobless Claims and Trump Speech to Drive EUR/USD Move
The European session started with a bang in German data. German Industrial Production for April rose 3.0% vs 0.9%...

Quick overview
- German Industrial Production for April rose 3.0%, significantly exceeding expectations and indicating a strong rebound in the manufacturing sector.
- The German Trade Balance improved to €21.1B, despite ongoing global trade uncertainties.
- In the U.S., Unemployment Claims were lower than expected at 228K, while Prelim Nonfarm Productivity and Unit Labor Costs showed mixed signals.
- The EUR/USD is testing a key resistance level at $1.13344, with potential for further movement depending on market reactions.
The European session started with a bang in German data. German Industrial Production for April rose 3.0% vs 0.9% expected and -1.3% in March. That’s a strong rebound in the manufacturing sector and a boost for the euro. German Trade Balance also rose to €21.1B from €18.0B previously, despite global trade uncertainty. But with French markets closed for a bank holiday, volumes are expected to be thin and price action choppy.
U.S. Jobless Claims and Trump Speech to Impact Dollar
In the U.S., Unemployment Claims came in at 228K vs 231K expected and Prelim Nonfarm Productivity dropped -0.8% in Q1 vs -0.4% expected.
Prelim Unit Labor Costs surged 5.7% vs 5.3% expected. That’s rising wage pressure that could complicate the Fed’s inflation fight.
President Trump’s speech at 2:00 pm will also be watched for policy signals, especially on trade and fiscal policy. That’s a risk event for EUR/USD.
EUR/USD Technical Outlook – Key Levels to Watch
The EUR/USD is trading at $1.13048 trying to break above the 50-day EMA at $1.13344. That’s a key level that has capped recent rallies. If it breaks above that, it could open up to $1.13786 (descending trendline) and then $1.14243.
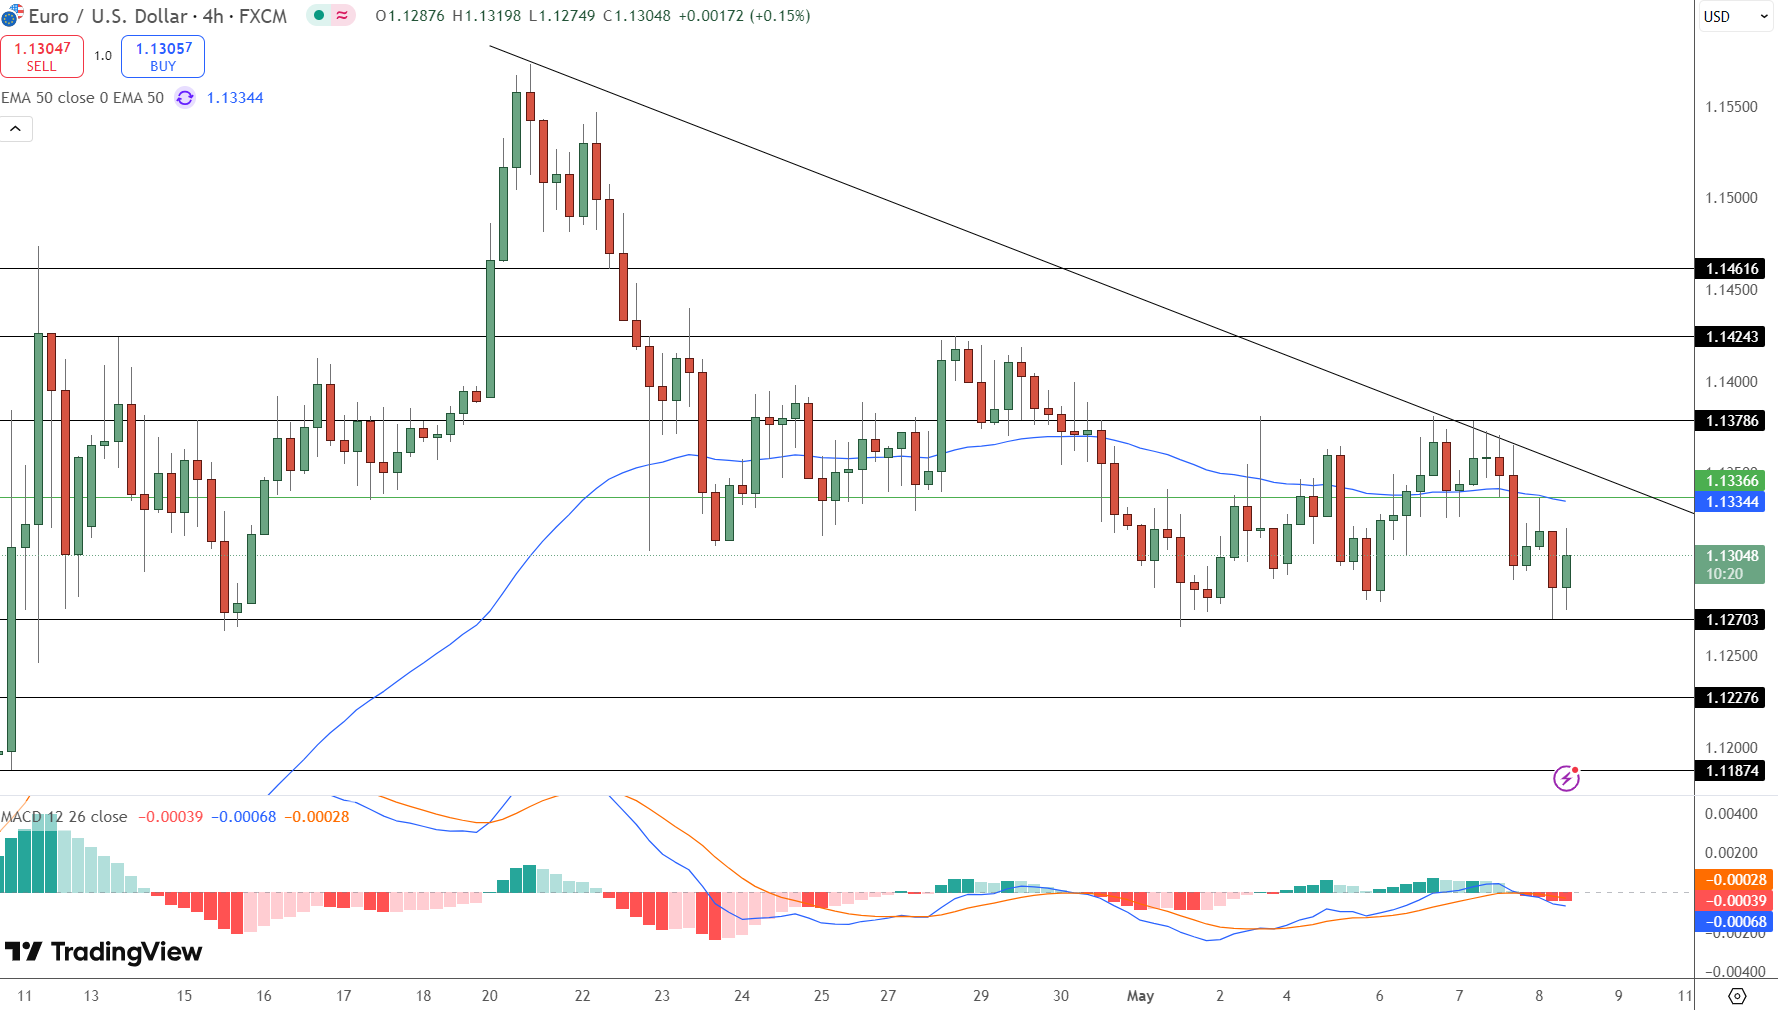
But if it fails to clear $1.13344, it could retest $1.12703, then $1.12276 and $1.11874. Recent candlestick patterns around the $1.1300 handle are spinning tops and dojis, indicating market indecision and the battle between the bulls and bears.
Key Technical Indicators:
-
50 EMA (50-Day Exponential Moving Average): $1.13344
-
MACD: Down but diverging
-
Candlesticks: Spinning tops and dojis
- Check out our free forex signals
- Follow the top economic events on FX Leaders economic calendar
- Trade better, discover more Forex Trading Strategies
- Open a FREE Trading Account
- Read our latest reviews on: Avatrade, Exness, HFM and XM
Related Articles
Sidebar rates
