PEPE Coin (PEPE) Surges 5% – Rounding Bottom Signals Extended Rally Potential
Pepe Coin (PEPE) is on the move again, up 5% today to $0.00001453, a new high since January 31. This is 68% up for the week...
Quick overview
- Pepe Coin (PEPE) has risen 5% today to $0.00001453, marking a 68% increase for the week due to a significant short liquidation.
- The bullish trend is confirmed by PEPE breaking above the 200-day EMA and the 61.80% Fibonacci level, with a potential target of $0.00003864.
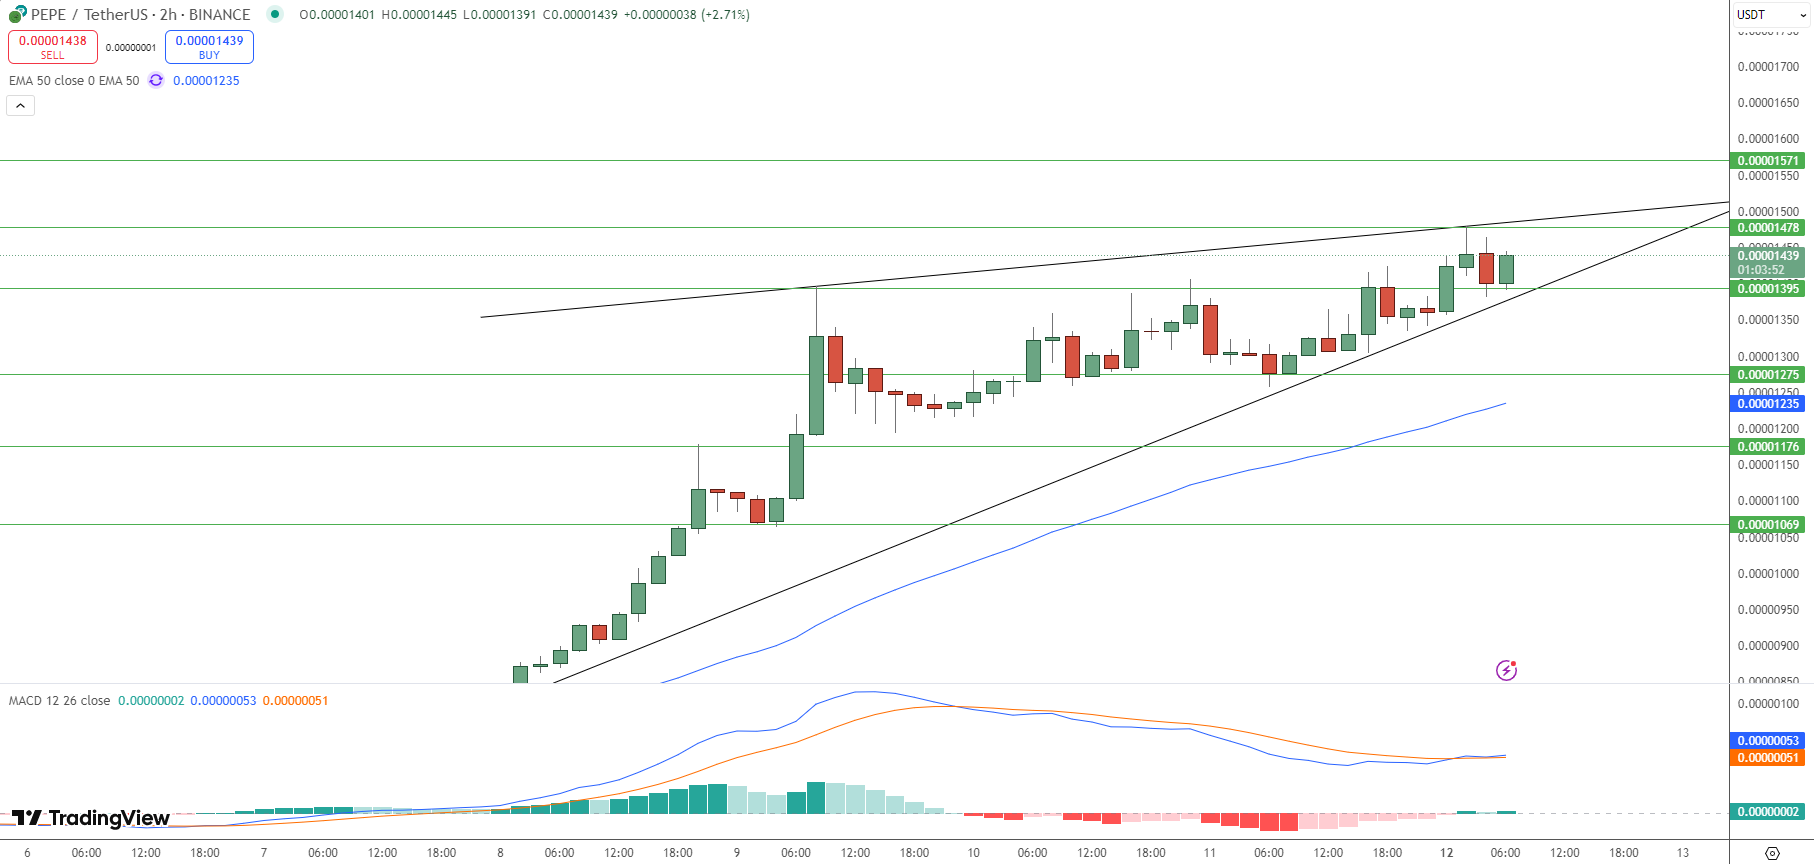
- Momentum indicators like MACD show increasing buying pressure, supporting the uptrend, while key resistance levels are identified at $0.00001870 and $0.00002649.
- Caution is advised as PEPE tests the upper boundary of a rising wedge pattern, with a potential pullback if it fails to break above $0.00001478.
Pepe Coin (PEPE) is on the move again, up 5% today to $0.00001453, a new high since January 31. This is 68% up for the week, mostly due to a $1.14 million short liquidation which forced bears to cover, and therefore buy.
The big bullish signal was when PEPE broke above the 200-day EMA and the 61.80% Fib at $0.00001426. This confirmed the rounding bottom pattern on the chart, which is a bullish trend. If PEPE closes above this neckline, it could go to the pattern target of $0.00003864, 170% from current price.
Technical Indicators Support Uptrend
Momentum indicators also support the bullish view. MACD has green histograms, buying pressure is building. Both MACD and signal lines are up, more bullish. 50 and 100-day EMAs are up, potential golden cross.
If up, next resistance is at $0.00001870 (78.60% Fib), then $0.00002649 (100% Fib), 75% from current price. If can’t close above $0.00001426, consolidation. If below $0.000010, bearish structure broken.
Rising Wedge: Be Careful
Despite the bullish indicators, be careful. PEPE/USDT is testing the upper boundary of a rising wedge, a pattern that often means reversal. If can’t break above $0.00001478, pullback to $0.00001395 is likely, 50-period EMA at $0.00001235 is strong support.
Trade Setup:
-
Buy Above: $0.00001478
-
Take Profit: $0.00001571
-
Stop Loss: $0.00001395
Be careful, if below $0.00001395. Mixed signals, watch the close.
- Check out our free forex signals
- Follow the top economic events on FX Leaders economic calendar
- Trade better, discover more Forex Trading Strategies
- Open a FREE Trading Account
- Read our latest reviews on: Avatrade, Exness, HFM and XM
Related Articles
Sidebar rates
