USD/CAD Price Holds Above 1.3950 as Fed Cut Bets Grow, Oil Prices Limit CAD Gains
Friday’s European session saw USD/CAD dip to 1.3955 as US inflation and labor data came in weaker than expected.
Quick overview
- USD/CAD dipped to 1.3955 as weaker US inflation and labor data increased expectations for Fed rate cuts.
- Despite a softening dollar, recent oil price drops are limiting gains for the Canadian dollar.
- USD/CAD is currently trading in a range of 1.3950-1.4000, influenced by conflicting economic signals.
- Technical analysis shows a bullish reversal at 1.3952, with key resistance at 1.3995.
Friday’s European session saw USD/CAD dip to 1.3955 as US inflation and labor data came in weaker than expected. The dollar is softening as traders are now more convinced the Fed will cut rates later this year. April’s PPI was 2.4% year over year, below the forecasted 2.5% and down from 2.7% in March. Core PPI, excluding food and energy, was 3.1%, a full percentage point lower than the previous month.
Adding to the dovish momentum, US initial jobless claims were steady at 229,000 and continuing claims rose to 1.881 million. With inflation easing and labor data showing cracks, traders are betting more on rate cuts. As of Friday, interest rate swap markets are pricing in at least two cuts by year end.
This is weighing on the dollar and putting pressure on USD/CAD despite overall market uncertainty.
Oil Price Drop Capping CAD Gains
The Canadian dollar usually benefits from a weaker dollar but recent oil price drops are capping CAD gains. Canada is a major oil exporter to the US so the Canadian dollar often moves in line with oil prices. This week’s oil slump is acting as a headwind for CAD even as the dollar is softening.
As a result, USD/CAD is stuck in a 1.3950-1.4000 trading range, caught between two opposing forces. Weak US data is encouraging dollar selling but lower oil prices are reducing demand for the loonie, creating a tug of war around key levels.
USD/CAD Technical Outlook: Bullish Reversal at 1.3952
From a chart perspective, USD/CAD bounced from the ascending trendline at 1.3950, which is also the 50 period EMA. The bounce was a bullish engulfing candle, indicating buyer commitment. The MACD histogram is green, showing early bullish momentum.
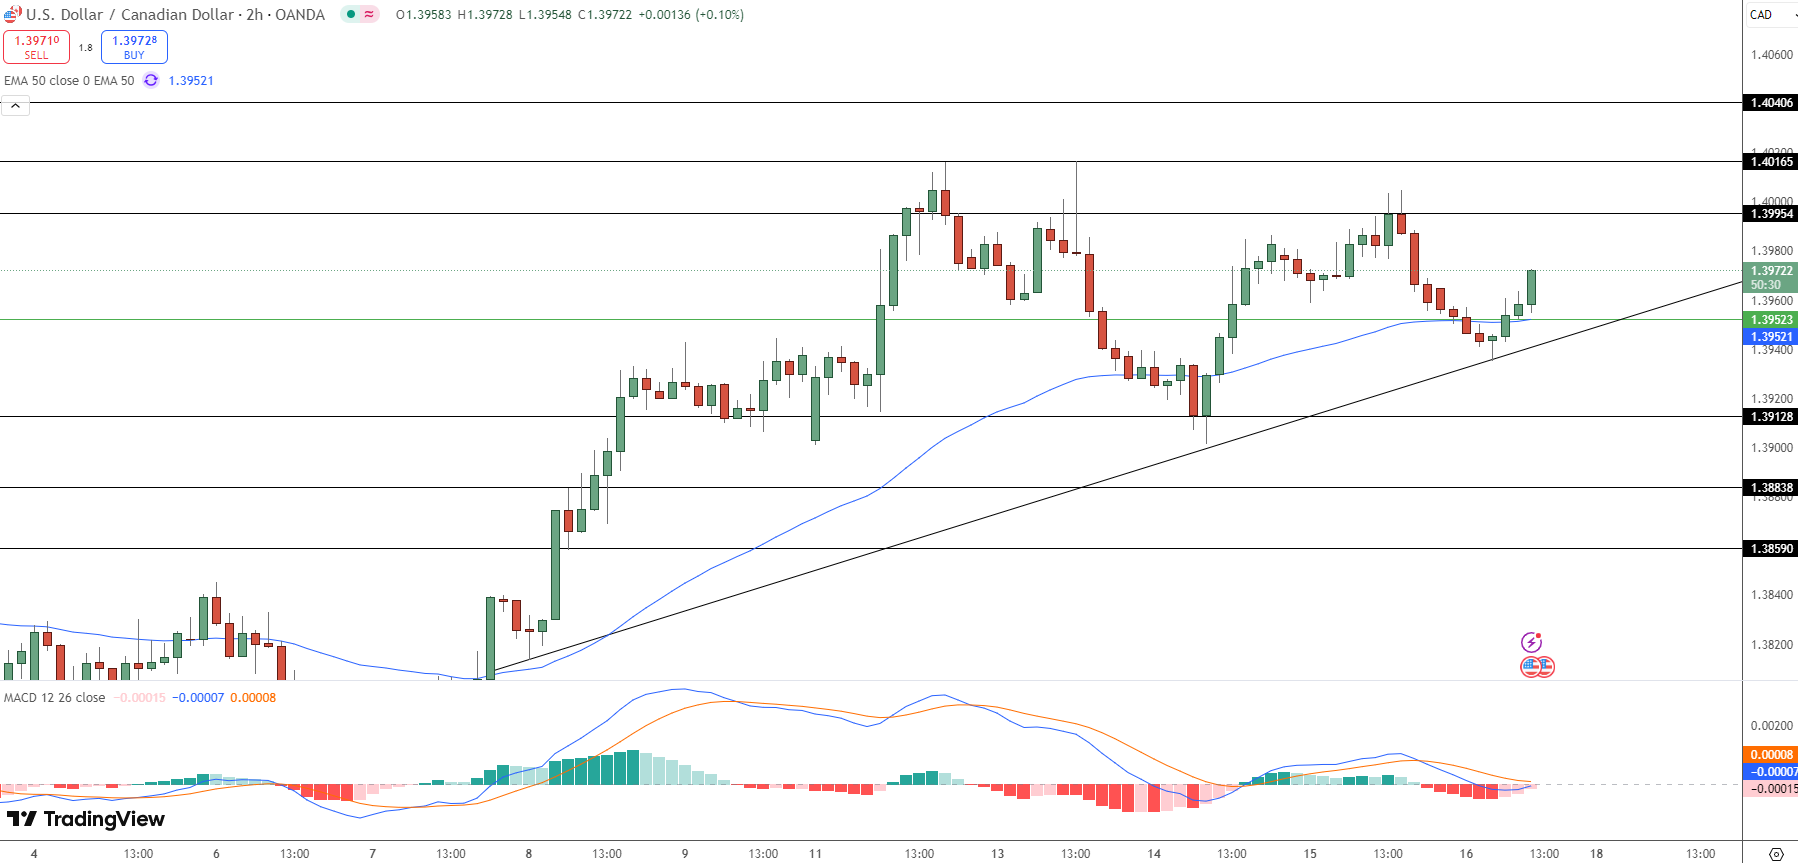
Price action also supports the trend continuation, with higher lows since the May 8 pivot. Watch the 1.3995 resistance zone for a breakout trigger.
Key Levels to Watch:
-
Bullish target: 1.3995 → 1.4015 → 1.4040
-
Support: 1.3950 → 1.3912
-
Trigger: Bullish engulfing candle above 1.3995
-
Stop: Below 1.3940 trendline
- Check out our free forex signals
- Follow the top economic events on FX Leaders economic calendar
- Trade better, discover more Forex Trading Strategies
- Open a FREE Trading Account