Solana Price Prediction: SOL Poised to Rebound After Trump Memecoin Controversy
Solana price prediction: SOL dipped after Trump memecoin drama, but key technicals hint at a rebound. Will SOL hit $187–190 or correct below

Quick overview
- Solana (SOL) experienced a 3.27% drop to $171.07 on May 25, 2025, following a brief spike above $181 amid market volatility.
- The decline was influenced by a politically charged event, leading to market jitters and a sell-off despite SOL being up 7% for the week.
- Derivatives data shows mixed sentiment, with a significant drop in futures volume and a bearish MACD crossover indicating selling pressure.
- If Bitcoin stabilizes above $106,000, Solana may retest the $187–190 zone, but failure to hold support at $173 could lead to further declines.
Solana (SOL) fell 3.27% to $171.07 on May 25, 2025 from Friday’s brief spike above $181. The weekend’s volatility came after Solana briefly overtook Binance Coin (BNB) as the 5th largest cryptocurrency, thanks to a politically charged event: the Trump memecoin dinner on the Solana blockchain.
The controversy caused market jitters and a quick sell off.
Despite the pullback, SOL is up 7% for the week and 16.9% for the last 30 days. Can Solana regain momentum? It depends on derivatives market positioning and broader crypto sentiment.
Derivatives Sentiment Mixed Despite Liquidations
Coinglass data shows mixed derivatives outlook. After SOL hit 60 day high at $186, traders started to liquidate:
- SOL futures volume dropped 46.4% to $11.31 billion, open interest down 3.8% to $7.35 billion.
- Options volume fell 67% to $653,270, open interest up 2.3% to $10.84 million.
But long/short ratios are optimistic:
- Binance’s ratio is 2.0572, OKX’s is 2.25, and Binance’s high frequency traders show even higher ratios at 2.1456 and 2.3825.
- Recent liquidations of $13.4 million, $12.3 million of which were longs, could clear out overextended positions if Bitcoin stays above $106,000.
Solana Technical Analysis
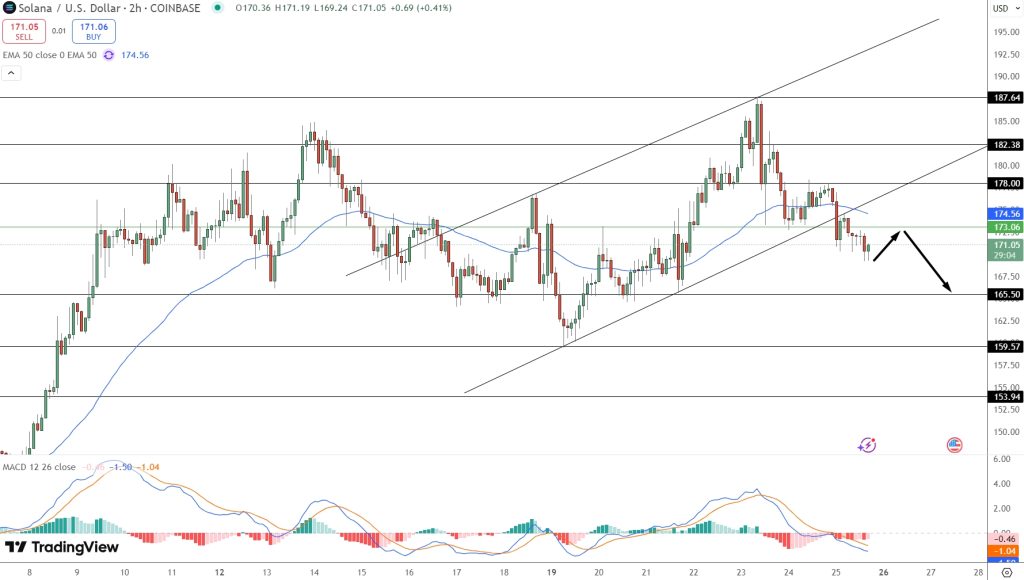
Solana SOL/USD 2 hour chart shows a classic pullback, SOL below mid term ascending channel and 50 period EMA ($174.56).
MACD bearish crossover and widening histogram indicates selling pressure.
Price is testing immediate support at $173.06, a break could target $165.50, then $159.57 and $153.94.
Key technicals:
- Channel Break: SOL broke below the trendline, sentiment change.
- EMA Resistance: 50 period EMA at $174.56 is capping the upside.
- MACD Momentum: Bearish crossover and widening histogram, sellers in control.
- Support: $173.06, break and could go to $165.50 or $159.57.
- Bullish: Above $178.00 and $182.38.
Be careful, the market is in a knife edge: below $173.06 and it could go down, above the EMA and a bullish engulfing candle or three white soldiers and it could recover.
Broader Market Outlook
If Bitcoin stabilizes above $106,000 and breaks higher, Solana could retest the $187–190 zone, with eyes on the $210 target. Conversely, failure to hold support at $173–174 may spark a correction toward $170.24 or even $160.
- Check out our free forex signals
- Follow the top economic events on FX Leaders economic calendar
- Trade better, discover more Forex Trading Strategies
- Open a FREE Trading Account
- Read our latest reviews on: Avatrade, Exness, HFM and XM
Related Articles