WTI Oil Watch: $61.76 Breakout Amid OPEC+ & Trade Drama
WTI Crude Oil rose on Monday to $61.76 per barrel after US President Donald Trump extended the EU trade deadline to July 9.
Quick overview
- WTI Crude Oil rose to $61.76 per barrel following the extension of the EU trade deadline by US President Trump, easing tariff pressures.
- OPEC+ plans to increase production by 411,000 barrels per day in July may cap further oil price gains despite the recent bounce.
- Technical indicators show WTI is holding at $61.76 with key resistance at $62.66, while recent candlestick patterns suggest market indecision.
- Traders are advised to wait for a close above $62.66 for bullish targets or to sell if the price falls below $61.46.
WTI Crude Oil rose on Monday to $61.76 per barrel after US President Donald Trump extended the EU trade deadline to July 9. This took the immediate pressure off US tariffs that could hurt global growth and oil demand.
Tony Sycamore at IG said this sparked a positive move, lifting both crude oil and US equity futures. European Commission President Ursula von der Leyen asked for more time for a deal and the market got some breathing space.
But this optimism is tempered by underlying concerns. Trade and tariff news and fiscal uncertainty will continue to influence crude oil prices this week.
OPEC+ Output Plans and Market Dynamics
Despite the bounce, oil gains were capped by OPEC+ output plans. They could increase production by 411,000 barrels per day (bpd) for July as part of their earlier plan to add 1 million bpd for April to June to offset supply concerns and limit price gains.
US data from Baker Hughes showed rig counts dropped 8 to 465 last week – the lowest since November 2021 – adding support to prices as domestic production faces pressure.
Suvro Sarkar at DBS Bank said “any price gains will be capped” as the market digests OPEC+ plans and a “mini oil price war”. Warren Patterson at ING said OPEC+ strategy will keep global markets supplied into 2H.
WTI Crude Oil Chart Signals: Key Levels to Watch
Technically WTI is holding at $61.76, up 0.18% in 24 hours but traders should be cautious. The 2-hour chart shows a bounce off the $61.46 support zone, supported by the 50-period EMA and a rising trendline. Resistance at $62.66 is a hurdle, with the MACD showing a tentative bullish crossover but no momentum.
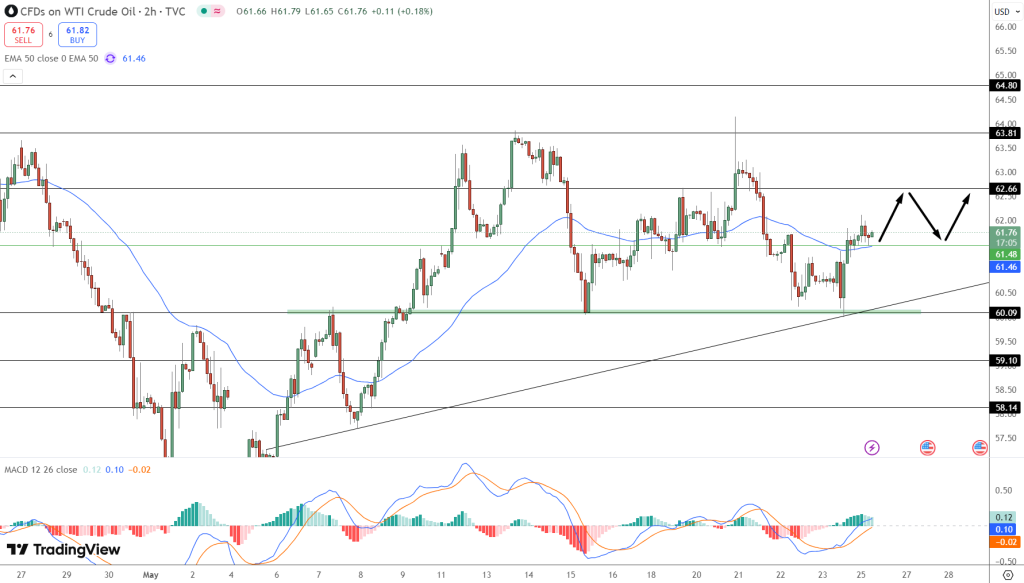
Recent candlesticks – doji and spinning tops – suggest indecision and a possible range-bound market in the short term.
Key levels to watch:
-
Support Range: $61.46–$60.09, EMA and trendline support.
-
Resistance: $62.66, $63.81, $64.80.
-
MACD: Bullish crossover but no follow-through.
For the trader: wait for a close above $62.66 to target $63.81 or higher, or sell if $61.46 fails. Confirmation through MACD and candles is key.
- Check out our free forex signals
- Follow the top economic events on FX Leaders economic calendar
- Trade better, discover more Forex Trading Strategies
- Open a FREE Trading Account
- Read our latest reviews on: Avatrade, Exness, HFM and XM