Gold’s $3,300 Pivot: 3 Key Signals Traders Can’t Ignore This Week
Gold prices have found their footing around $3,300 an ounce this week. After slipping below this key level, buyers stepped...
Quick overview
- Gold prices stabilized around $3,300 an ounce this week after easing U.S.-EU trade tensions.
- The upcoming U.S. core Personal Consumption Expenditures report is crucial for understanding inflation and potential Fed interest rate moves.
- Gold's chart shows a symmetrical triangle pattern, indicating potential breakout or breakdown points.
- Traders should watch for a strong close above $3,316 for a bullish signal or a drop below $3,280 for a bearish indication.
Gold prices have found their footing around $3,300 an ounce this week. After slipping below this key level, buyers stepped in, giving the market a bit of a breather. The immediate catalyst? U.S.-EU trade tensions easing. President Trump backed off his threat of a 50% tariff on European goods, giving both sides until July 9 to hash things out. This move took the edge off market anxiety, giving gold room to stabilize.
But that doesn’t mean it’s clear sailing. All eyes are now on the upcoming U.S. core Personal Consumption Expenditures (PCE) report, due Friday. This report’s a big deal because it offers clues about inflation and could sway the Fed’s next interest rate moves. Until then, traders are treading carefully, waiting for fresh data before making big bets.
Triangle Breakout or Breakdown? Watch These Levels
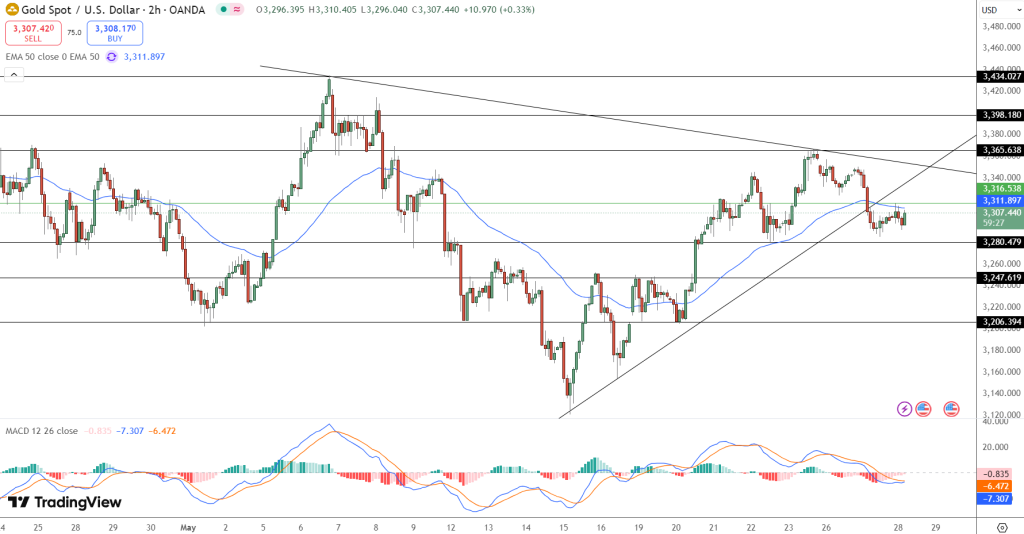
Technically, gold’s chart is flashing an intriguing pattern. The 2-hour chart shows a symmetrical triangle—a sign that price action is coiling up and getting ready to burst out, one way or another. This triangle has formed through a series of lower highs and higher lows, with the price hovering near $3,307. It’s brushing up against the dynamic resistance of the 50-period EMA at $3,311, a level that’s seen price rejection multiple times.
Candlestick patterns like spinning tops and dojis near this resistance highlight the indecision in the market. If gold manages to break and close above $3,316, bulls could target the next resistance levels at $3,365 and $3,398. The MACD is hinting at a bullish crossover, but confirmation is needed.
On the flip side, if gold can’t punch through, prices might fall back to support levels at $3,280 and $3,247. A drop below $3,247 could even drag it toward $3,206, signaling a deeper pullback.
Top 3 Signals for Traders This Week
-
Breakout Confirmation: A strong close above $3,316 with bullish engulfing candles or “three white soldiers” can signal a rally.
-
Support Check: If prices drop below $3,280 or $3,247, it might indicate a breakdown.
-
PCE Watch: The U.S. core PCE report on Friday could shake things up, especially if inflation surprises.
In short, patience is key. Whether you’re a pro or just starting out, this market rewards those who wait for clear signals. Stay alert and trade with discipline.
- Check out our free forex signals
- Follow the top economic events on FX Leaders economic calendar
- Trade better, discover more Forex Trading Strategies
- Open a FREE Trading Account
- Read our latest reviews on: Avatrade, Exness, HFM and XM
Related Articles


Sidebar rates
Related Posts
