USD/JPY Eyes 142.13 as Russia-Ukraine Tensions Fuel JPY Strength
The USD/JPY is stuck at 142.71 as risk aversion grows with global uncertainty. On the 1-hour chart, price is in a clear descending...
Quick overview
- The USD/JPY is currently at 142.71, trapped in a descending channel amid rising global risk aversion.
- Safe-haven demand for the yen is increasing due to escalating tensions from the Russia-Ukraine conflict and concerns over USD assets.
- Recent economic data shows the USD struggling, with ISM Manufacturing PMI at 49.3 and mixed signals from the Fed.
- Technical indicators suggest a bearish bias for USD/JPY, with potential long and short trade setups outlined.
The USD/JPY is stuck at 142.71 as risk aversion grows with global uncertainty. On the 1-hour chart, price is in a clear descending channel with lower highs and lower lows. The 50-period EMA at 143.77 is now acting as dynamic resistance, capping any upside. Recent candlestick patterns, long upper wicks and doji at resistance, are also bearish.
It’s not just technicals. Safe-haven demand is surging as Russia and Ukraine’s conflict escalates. Overnight air attacks by both sides have added to the fragile backdrop to the second round of peace talks in Türkiye. Kyiv arrived in Istanbul, meeting Moscow’s negotiators with minimal progress from previous talks. Ukraine’s President Zelenskyy is also seeking NATO security guarantees, adding to market tension.
This geopolitical uncertainty is making the yen a haven, especially as investors get nervous about USD assets, pressured by the Fed’s dovish tone and US debt concerns.
Economic Data and Fed Speeches
The USD’s fundamentals aren’t helping either. ISM Manufacturing PMI came in at 49.3, still contracting. Although ISM Manufacturing Prices jumped to 70.2, it hasn’t changed the dollar’s tone. The market awaits clarity from multiple FOMC speakers, including Powell, but with mixed data and geopolitical tensions, the bias is still JPY.
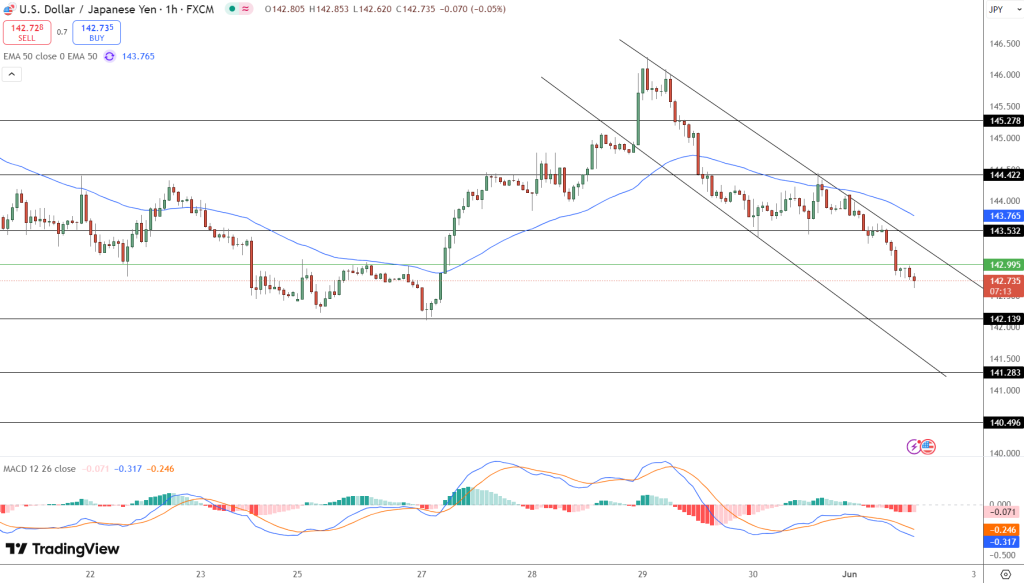
The USD/JPY’s momentum is confirmed by the MACD histogram below zero, with signal lines crossing down, and price struggling to hold above 142.13.
Trade Setup: Going Long JPY
-
Short Setup: A break below 142.13 could trigger a move to 141.28 or 140.50. Set a stop above 143.53.
-
Long Opportunity: A bullish engulfing candle and MACD crossover could push USD/JPY above 143.53, to 144.42+. Use a stop below 142.95.
- Check out our free forex signals
- Follow the top economic events on FX Leaders economic calendar
- Trade better, discover more Forex Trading Strategies
- Open a FREE Trading Account
- Read our latest reviews on: Avatrade, Exness, HFM and XM
Related Articles


Sidebar rates
Related Posts
