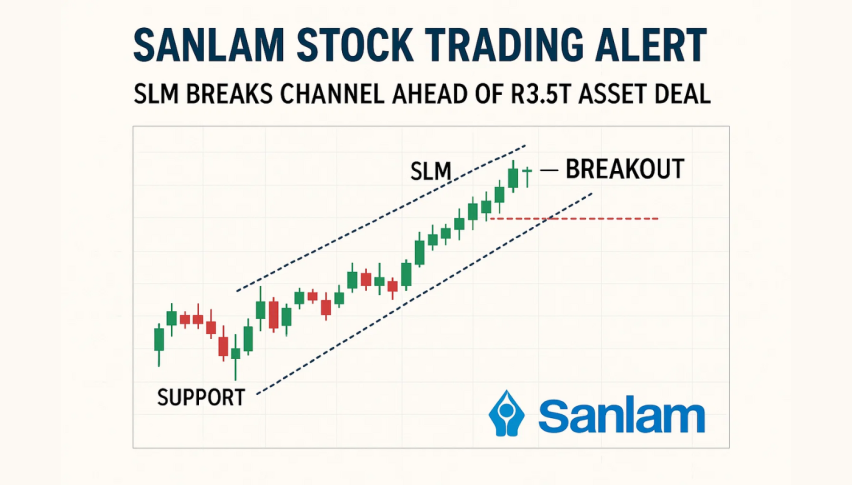
Sanlam Stock Trading Alert: SLM Breaks Channel Ahead of R3.5T Asset Deal
Solana (SOL) up 1.2% to $152 as institutional activity and ETF hopes boost sentiment. Bloomberg’s Eric Balchunas
Quick overview
- Sanlam Limited's share price fell below ZAR 8,633 ahead of a significant acquisition by Ninety One plc, which is set to enhance its global focus.
- The acquisition, involving the issuance of 13.7 million shares, is expected to increase Ninety One's total assets under management to over R3.5 trillion.
- Local economic indicators show stable inflation at 2.8% YoY but a decline in retail sales by 0.2% MoM, indicating weakening consumer demand.
- Technically, Sanlam has broken below key support levels, suggesting a bearish trend unless it can regain momentum above ZAR 8,768-8,900.
Sanlam Limited’s share price dropped below key support at ZAR 8,633 just ahead of the big transaction with its UK asset management business. Short term pressure, but the strategic realignment is to sharpen Sanlam’s global focus.
June 16, 2025 is when Ninety One plc will complete the acquisition of Sanlam Investments UK. The deal, revised earlier this year, includes the issue of 13.7 million shares to Sanlam and will be dual listed on the LSE and JSE the next day. Executives expect a big boost to Ninety One’s total assets under management (AuM) to over R3.5 trillion.
This is a deeper integration of Sanlam’s global ambitions with a well known institutional manager, but investor caution remains.
Sanlam Limited: Local Macro Adds to Uncertainty
Local South African data added to the gloom. Inflation was stable at 2.8% YoY, within the central bank’s target range, but retail sales dropped 0.2% MoM – a sign that local consumer demand is softening.
- Inflation (YoY): 2.8% – SARB to hold rates steady
- Retail Sales (MoM): -0.2% – demand is weakening
- Sanlam sector exposure: insurance and asset management tied to consumption
A dovish policy stance may be some relief, but questions around consumer resilience will weigh on financial sector earnings – including Sanlam’s.
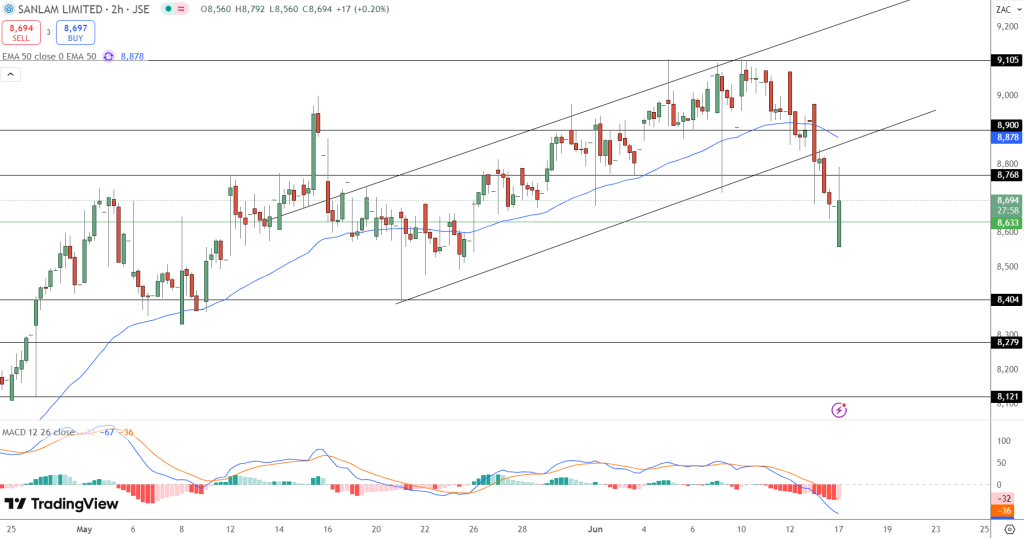
Sanlam Limited Technical Breakdown Bearish
Technically Sanlam (JSE: SLM) has broken below its rising channel and 50-EMA (ZAR 8,878) on the 2-hour chart. A quick bounce off 8,633 formed a long lower wick, but weak MACD momentum is not convinced.
- Support levels: 8,633, 8,404, 8,279
- Resistance zones: 8,768, 8,900
- MACD: Histogram in red – weak momentum
- Pattern: Ascending channel broken – bearish tilt in place
Unless bulls get back above 8,768-8,900 with conviction, the path of least resistance is down. Watch for consolidation unless macro or high volume buying changes the momentum.
- Check out our free forex signals
- Follow the top economic events on FX Leaders economic calendar
- Trade better, discover more Forex Trading Strategies
- Open a FREE Trading Account
- Read our latest reviews on: Avatrade, Exness, HFM and XM