Silver Soars 12% in June as Prices Hit $37.28 with Fed and Dollar in Focus
Silver surged in European trade Tuesday, up for the second day in a row and hitting $37.28, just below a 13-year high. The metal is up 12%
Quick overview
- Silver prices surged to $37.28, marking a 12% increase in June due to strong industrial demand and a weaker US dollar.
- The US dollar index dipped 0.1%, making silver more attractive to international buyers as investors await key retail sales data.
- Technically, silver is nearing a resistance zone at $37.36, with signs of potential exhaustion in the rally.
- Market outlook suggests a bearish setup below $37.03 targeting $36.57, while a bullish breakout above $37.36 could lead to $37.81.
Silver surged in European trade Tuesday, up for the second day in a row and hitting $37.28, just below a 13-year high. The metal is up 12% in June on strong industrial demand, retail interest and a weaker US dollar.
Prices reached a high of $37.30 and a low of $36.15 before settling at $37.28. It’s clear silver is still undervalued relative to gold as the world moves to increase clean energy production where silver plays a key role.
- Silver Price Today: $37.28
- June Performance: +12%
- 2023 Peak: Highest since February 2023
- Session Range: $36.15 – $37.30
Dollar Dips, Fed Decision Looms
The US dollar index slipped 0.1% against a basket of major currencies, helping silver. A softer dollar makes dollar-denominated commodities like silver more attractive to international buyers and boosts demand.
Investors are also waiting for US retail sales data later today which will give clues on Q2 growth. The Fed begins its 2-day policy meeting today with the rate decision due tomorrow.
Markets expect the Fed to keep rates steady but will be watching the dot plot and future policy guidance.
- Dollar Index: Down 0.1%
- Retail Sales: Key to Fed outlook
- Fed Policy Meeting: Decision tomorrow
Rising Wedge Warns of Possible Reversal
From a technical perspective, silver (XAG/USD) is approaching the resistance zone at $37.36, the upper boundary of the rising wedge on the 1-hour chart. This pattern often precedes a pullback especially when momentum is weakening. The MACD histogram is flat and the signal lines are converging – both signs of exhaustion in the rally.
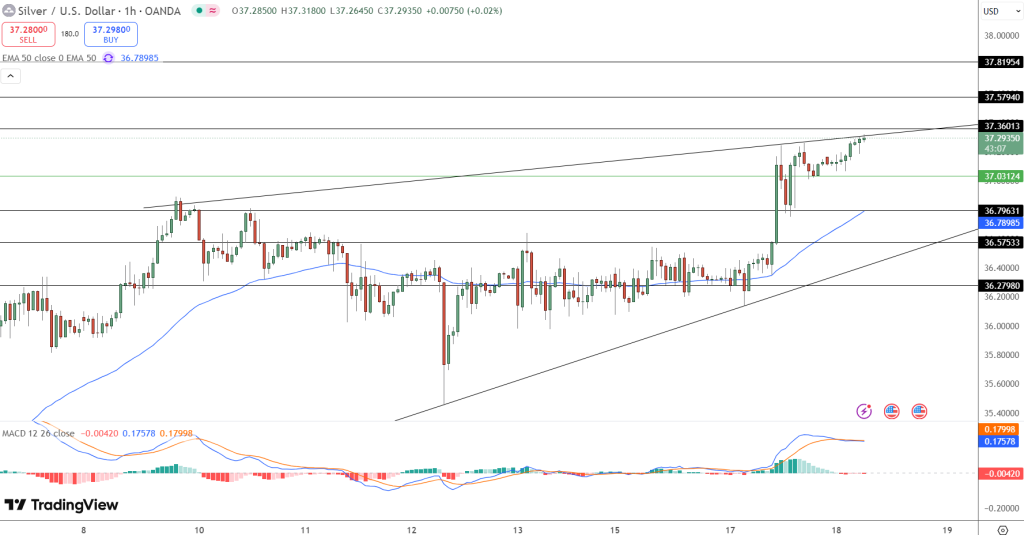
The 50-period EMA at $36.78 is support and bulls may still be in control if the price breaks above $37.36 with volume. But a failed breakout could trigger a move down to $36.79 or $36.57.
Trade Outlook:
- Bearish Setup: Close below $37.03 → Target $36.57
- Bullish Setup: $37.36 → $37.81
- Indicators: MACD, volume, candlestick
- Check out our free forex signals
- Follow the top economic events on FX Leaders economic calendar
- Trade better, discover more Forex Trading Strategies
- Open a FREE Trading Account
- Read our latest reviews on: Avatrade, Exness, HFM and XM