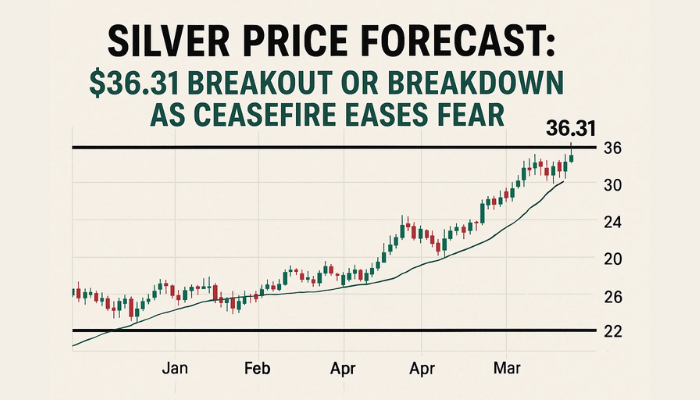
Silver Price Forecast: $36.31 Breakout or Breakdown as Ceasefire Eases Fear
Silver (XAG/USD) is stuck in a tight range, trading just below the key resistance at $36.31. The market is waiting for headlines to settle..
Quick overview
- Silver (XAG/USD) is currently trading just below the key resistance level of $36.31, with market participants awaiting further developments following a temporary ceasefire between Israel and Iran.
- Recent price action shows indecision, characterized by dojis and spinning tops, while the 50-period EMA indicates consolidation without a clear trend.
- Traders are closely monitoring resistance at $36.31 and support at $35.61, with potential for a breakout or breakdown depending on price action.
- The MACD is showing a bearish trend but is weakening, suggesting that traders should wait for confirmation before making any directional trades.
Silver (XAG/USD) is stuck in a tight range, trading just below the key resistance at $36.31. The market is waiting for headlines to settle down after the temporary ceasefire between Israel and Iran, and safe-haven demand has softened. While geopolitical tensions had driven silver higher in recent weeks, this calm may not last. For now, traders are looking at technicals more than headlines.
After a strong rejection from the recent high of $36.99, silver found support near $35.61, where the ascending trendline from early June has caught buyers again. But so far, upside momentum has not been able to get above the 50-period EMA, currently at $36.25.
Silver’s Technicals are in a Standoff
The chart is showing indecision, not conviction. Dojis and spinning tops are dominating recent sessions, no trend direction. The 50-EMA, a short-term trend indicator, has lost slope, indicating consolidation.
The MACD is trying to go bullish. The histogram is slowly moving towards the zero line, but the MACD and signal lines are still bearish—an ambiguous setup for directional trades.
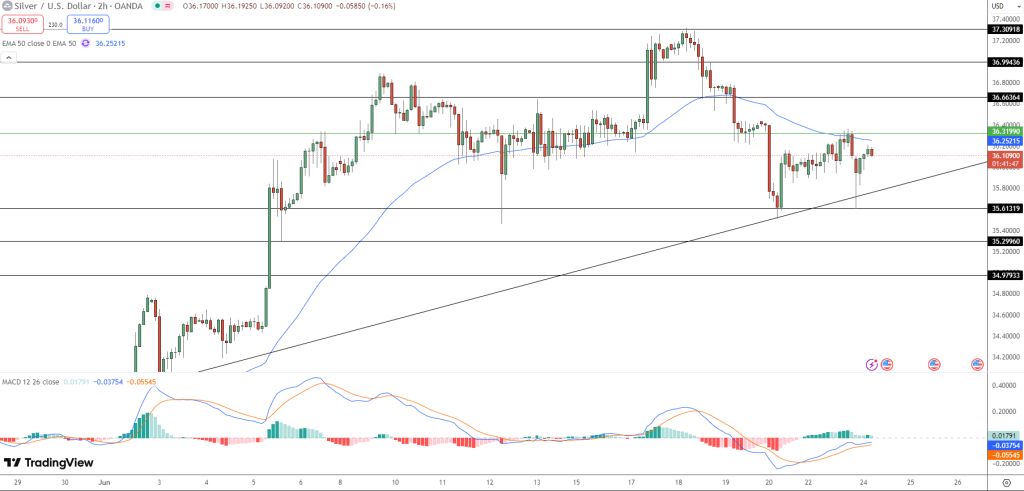
- Resistance to watch: $36.31, then $36.66 and $36.99
- Support to monitor: $35.61 trendline, then $35.29 and $34.97
- EMA status: 50-period EMA flat, not trending
- MACD trend: Bearish but weakening
Trade Setup: Breakout or Breakdown?
Traders are in a squeeze between resistance and trendline support—often a precursor to a breakout. A clean 2-hour close above $36.31 may trigger a move to $36.66 or even $36.99, resuming the bigger up trend. But if sellers defend the level and price closes below $35.61, it may be a short-term top, and then $35.29.
The best strategy? Wait for price to confirm the next move. In this market, reacting beats predicting.
- Check out our free forex signals
- Follow the top economic events on FX Leaders economic calendar
- Trade better, discover more Forex Trading Strategies
- Open a FREE Trading Account
- Read our latest reviews on: Avatrade, Exness, HFM and XM