Bitcoin Consolidates Above $108K, Technical Indicators Signal Potential Breakout to $117K
Bitcoin (BTC) is still holding strong above $108,000, and in the last 24 hours, it has gone up around 3%. It is now only 2% behind its ATH
Quick overview
- Bitcoin is currently trading above $108,000, having increased by approximately 3% in the last 24 hours, and is close to its all-time high of nearly $110,000.
- Technical analysis suggests a potential short-term target of $117,000, supported by the short-term holder cost basis and MVRV indicators.
- Despite the positive price action, the derivatives market shows cautious sentiment among professional traders, indicating uncertainty about the sustainability of the recent rally.
- Macroeconomic factors and political developments add complexity to the market, with potential implications for Bitcoin's future price movements.
Bitcoin BTC/USD is still holding strong above $108,000, and in the last 24 hours, it has gone up around 3%. It is now only 2% behind its all-time high of almost $110,000. Even while the price action is strong, technical analysis and market mood indicators show that there are both opportunities and problems ahead for the world’s largest cryptocurrency.
BTC/USD Technical Analysis Points to $117K Short-Term Target
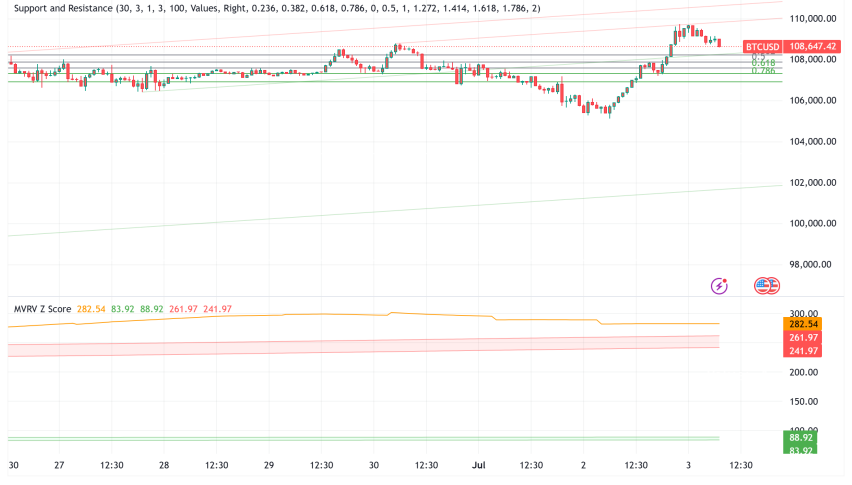
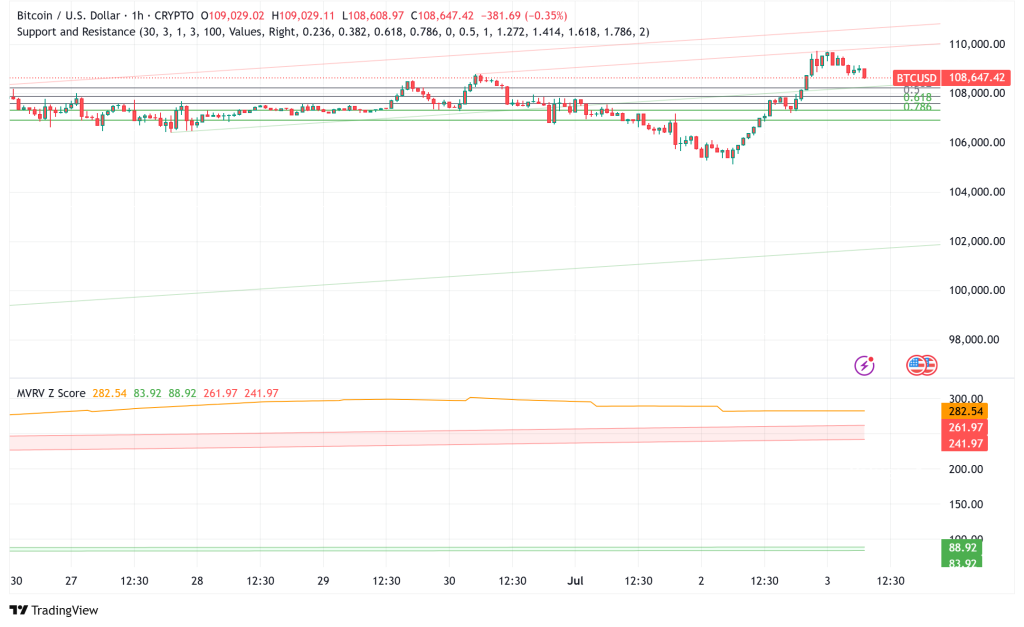
Glassnode, an on-chain analytics platform, has found a strong technical setup for Bitcoin. The short-term holder (STH) cost basis suggests that the price might go up to $117,000. The STH cost basis, which keeps track of the average price that those who have held Bitcoin for less than 155 days paid for it, is currently at $117,113.
Glassnode said that “the upper boundary of the STH cost basis was tested only once in late May and currently stands at $117,113.” They called this level “the upper band of the short-term price action.”
The Market Value Realized Value (MVRV) indicator backs up this positive view by showing that Bitcoin has more opportunity to grow before it becomes too expensive. The MVRV extreme deviation price bands show that the upper limit is about $123,000, which supports the idea that the current rally may have further legs.
Critical Resistance Levels Define Near-Term Trajectory
Rekt Capital, a well-known analyst, has named the $109,000-$110,000 zone as a key breakout milestone. This is because it is a multimonth descending trendline that Bitcoin has tested many times. The analyst stressed that “Bitcoin needs to close above the downtrend line every day and test it again as support to confirm the breakout.”
Another trader, Jelle, agrees with this and says that a strong close above $110,000 might start a measured rise above $130,000, based on the creation of a bull flag pattern on the daily timeframe.
Derivatives Market Reveals Cautious Sentiment
Even if Bitcoin is close to its all-time highs, derivatives data show that professional traders are hesitant. The Bitcoin futures premium has stayed below the neutral 5% level and is now at 4%, which shows that there isn’t much demand for leveraged long bets.
The options market tells a similar story: the 25% delta skew is at 0%, which means that the risks of price changes going either way are equal. This neutral position is better than the bearish mood that was present in late June, but it also shows that institutional traders are still not sure if the recent rebound will last.
Macroeconomic Factors Create Complex Backdrop
The current rise happened at the same time as some big changes in the economy, such the eurozone’s broad money supply growth of 2.7% year-over-year, which is the highest it has ever been, and the U.S. labor market data, which showed a 33,000 drop in private payrolls. But rising trade tensions throughout the world have made things unclear, with President Trump proposing tariffs of more than 30% on Japanese imports.
Notably, demand for cryptocurrencies in China has dropped dramatically, as shown by a 1% Tether (USDT) discount compared to the official USD exchange rate. This is the worst drop since mid-May. This discount usually means that investors are scared and money is leaving the crypto markets.
Extended Consolidation Phase Nears Potential Resolution
According to Analyst Crypto Con’s whole cycle analysis, Bitcoin has been moving sideways for 195 days in a row from December 18, 2024, without making a new local high. It’s amazing that only 36 days of the current cycle have witnessed significant advances. The rest of the time, the market has been stuck in a range.
Even though this period of stasis has lasted a long time, the analyst says, “the cycle is not over yet.” This suggests that sustained accumulation could be creating pressure for a big breakout toward objectives between $165,000 and $180,000.
Political Developments Add Uncertainty
President Trump’s “One Big Beautiful Bill” passed the Senate. It includes a $4.5 trillion spending package and a possible $5 trillion rise in the debt ceiling. This has changed the way the market works. Bitcoin supporters think that more government spending could be good for the currency, but historical data reveals that this has not always been the case after debt ceiling increases.
It’s still unclear how the law will affect Bitcoin, especially because the 10-year Treasury yield has dropped from 4.50% in early June to 4.25% now. This could mean that traditional risk indicators and Bitcoin’s price movement are starting to move in different directions.
Bitcoin Price Prediction and Outlook
Bitcoin looks like it could break out over the $109,000-$110,000 resistance zone based on the combination of technical indicators. If this level is broken, it might lead to a move to the STH cost basis upper bound at $117,000, and then to the $123,000-$130,000 zone based on MVRV measures and bull flag projections.
However, traders should keep in mind that the derivatives market is cautious and that there are bigger economic uncertainties that could affect when and how big any breakthrough would be. The long 195-day consolidation phase indicates that when Bitcoin does move, it might be quick and big, which is in line with past trends where big changes happen in short time spans of just 2-5 days.
The cryptocurrency’s ability to stay above $108,000 while constructing this technical base may be very important for the next stage of the current market cycle.
- Check out our free forex signals
- Follow the top economic events on FX Leaders economic calendar
- Trade better, discover more Forex Trading Strategies
- Open a FREE Trading Account
- Read our latest reviews on: Avatrade, Exness, HFM and XM
Related Articles


Sidebar rates
Related Posts
