ETH Eyes $5,000 Target Despite Recent Correction as Ethereum Genesis Wallets Awaken
Two Ethereum wallets that haven't been used since the blockchain started in 2015 have unexpectedly come to life and moved a total of 1,140
Quick overview
- Two dormant Ethereum wallets have been activated, moving 1,140 ETH worth nearly $2.9 million, after being inactive since 2015.
- Ethereum's price has stabilized between $2,400 and $2,800, with bullish momentum indicated by recent technical analysis.
- Institutional interest in Ethereum is rising, evidenced by significant ETF inflows and a decrease in exchange supply to eight-year lows.
- Market sentiment remains optimistic, but traders should monitor key support levels to avoid potential downturns.
Two Ethereum wallets that haven’t been used since the blockchain started in 2015 have unexpectedly come to life and moved a total of 1,140 ETH, which is worth almost $2.9 million. The wallets, called “0x27” and “0x7f,” were made 3,630 days ago, on July 30, 2015, which was the day Ethereum’s mainnet went live during the “Frontier” phase.
Over the past ten years, these Genesis wallets have seen their holdings rise by an incredible 89,450%. What were once experimental tokens are now worth millions of dollars. The timing of its activation is perfect because institutional interest in Ethereum is growing again, as shown by steady ETF inflows and better on-chain metrics.
ETH/USD Technical Analysis Points to Bullish Momentum Despite Current Consolidation
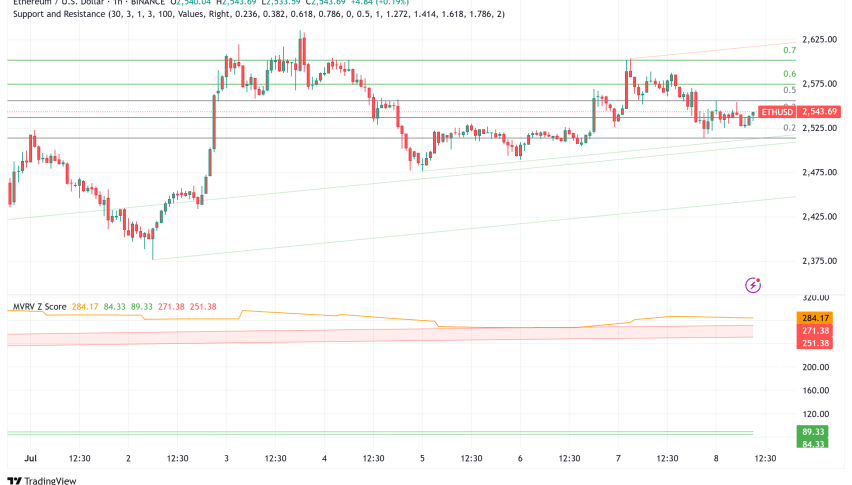
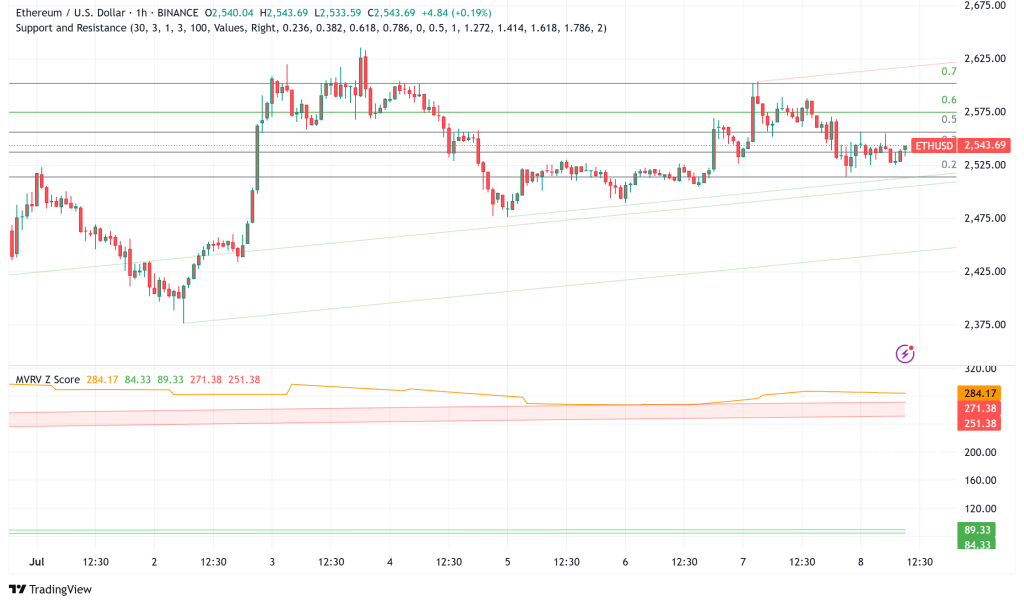
Ethereum ETH/USD is currently trading at over $2,500, down 1.5% in the last 24 hours. This is normal market behavior and not because of any problems with the currency itself. Recent price movements show that ETH is stabilizing in a clear range between $2,400 and $2,800, getting ready for its next big move.
Key Support and Resistance Levels
Current technical analysis reveals several critical price levels that will determine Ethereum’s near-term trajectory:
Support Levels:
- Primary support: $2,520 (current test level)
- Secondary support: $2,500 (psychological level)
- Major support: $2,450-$2,350 zone
Resistance Levels:
- Immediate resistance: $2,580
- Key resistance: $2,600 (major breakout level)
- Target resistance: $2,650-$2,720
The hourly chart shows that bulls are still in charge, even though there was a recent setback. This is shown by the development of a bullish trend line with support at $2,530. A clear break above $2,600 might cause a quick rise toward $2,800 and higher.
Institutional Demand Drives Bullish Fundamentals
Ethereum ETF Inflows Signal Strong Institutional Interest
According to CoinShares data, Ethereum-based investment products have been quite strong, with net inflows of $226.4 million last week. This is an average of 1.6% of assets under management coming in each week for 11 weeks in a row, which is twice as much as Bitcoin’s 0.8% rate.
BlackRock’s iShares Ethereum Trust (ETHA) is the biggest US-based spot Ethereum ETF, and it has seen almost $510 million in positive net flows over the previous two weeks. This is the seventh week in a row that there have been positive inflows, bringing the total to more than 61,000 ETH. This shows that institutions still want to invest in Ethereum.
Exchange Supply Hits Eight-Year Lows
The sharp drop in the amount of ETH available on exchanges is probably the most convincing sign that prices will go up. According to Glassnode data, exchange balances have plummeted to 13.5%, which is the lowest level since July 2016. This kind of supply shock, along with rising demand, usually comes before big price increases.
Large holders (wallets with more than 100,000 ETH) have added to their holdings, going from 18.1 million ETH on May 21 to 18.8 million ETH. This shows that whales are still buying instead than selling during recent price surge.
Ethereum Price Prediction: Path to $5,000 Remains Intact
MVRV Bands Suggest Room for Further Expansion
The Market Value to Realized Value (MVRV) extreme deviation pricing bands show that Ethereum has a lot of opportunity to expand before it becomes too expensive. The present trading range of $2,400 to $2,800 is significantly below the extreme MVRV bands, which are between $4,000 and $5,000.
V-Shaped Recovery Pattern Targets $4,800
The weekly chart for Ethereum shows a distinct V-shaped recovery trend that started to build in December 2024. ETH needs to break through the important supply-demand zone between $2,600 and $2,800, where the 50-day and 100-day moving averages meet, in order for this pattern to finish.
If the breakout is successful, it will probably go after the neckline of the pattern around $4,100. The next obvious move would be to the all-time high of $4,800 in 2021, which would be a possible 92% rise from where it is now.
Market Sentiment and Risk Factors
The Spent Output Profit Ratio (SOPR) is currently at 1.01, which means that short-term holders are still confident and don’t want to sell at these prices. This number shows that recent purchases aren’t putting a lot of selling pressure on the market, which supports the optimistic argument.
Traders should, however, keep a close eye on the $2,520 support level. If the price drops below this important level, it could go down significantly more, to $2,450 or possibly $2,350, which could make the short-term positive forecast meaningless.
- Check out our free forex signals
- Follow the top economic events on FX Leaders economic calendar
- Trade better, discover more Forex Trading Strategies
- Open a FREE Trading Account
- Read our latest reviews on: Avatrade, Exness, HFM and XM