Bitcoin Faces Critical Support Test at $112K: Whale Activity and Dollar Dynamics Shape Near-Term Outlook
Bitcoin (BTC) is currently trading at $114,000. It has been relatively stable over the previous 24 hours, even though there are tensions in
Quick overview
- Bitcoin is currently trading at $114,000 and has shown stability despite market tensions.
- Long-term holders are beginning to sell, while short-term holders are experiencing significant losses.
- Corporate interest remains strong, with MicroStrategy continuing to accumulate Bitcoin, although concerning wallet movements raise questions.
- Technical analysis indicates critical support around $112,000, with potential scenarios ranging from consolidation to a bearish drop below this level.
Bitcoin BTC/USD is currently trading at $114,000. It has been relatively stable over the previous 24 hours, even though there are tensions in the market that could affect the cryptocurrency’s next big move. The digital asset is at a very important point right now. Technical indicators and on-chain data show a complicated picture of contending forces in the market.
Dollar Weakness Provides Tailwinds but Macro Headwinds Persist
BTC’s Inverse Correlation with DXY Offers Hope for Bulls
As currency dynamics change, Bitcoin’s historical opposite relationship with the US Dollar Index (DXY) is once again coming to light. The DXY dropped to 98.5 after failing to go back to 100. This was because US jobs data was worse than expected, which made them think the Federal Reserve will cut interest rates. When the dollar loses its yield advantage, investors look for other places to deposit their money, which usually helps Bitcoin.
Credit Market Signals Flash Warning Signs
But macro economists are seeing worrying signs in the credit markets that could limit Bitcoin’s potential for growth. The ICE BofA High Yield Option-Adjusted Spread, which is now at 3 and close to its 200-day moving average, shows that the market mood is neither too positive nor too negative. Historically, this measure of risk appetite has been linked to changes in the price of Bitcoin. If it goes up a lot, it might mean that investors are fleeing to safety, which would put pressure on riskier assets like cryptocurrency.
Bitcoin’s On-Chain Analysis Reveals Shifting Holder Dynamics
Long-Term Holders Begin Profit-Taking Wave
Recent study of the blockchain shows that holders are acting in a way that could change the course of Bitcoin in the near future. Long-term holders (LTH) have started to sell into strength. One big move was the sale of almost 80,000 BTC from “Satoshi-era” wallets that had been inactive for about 14 years. This selling pressure from diamond-handed holders is a big alteration in how the market works.
Short-Term Holders Capitulate Under Pressure
In addition to the LTH selling, short-term holders (STH) have been losing a lot of money. Analysts have been keeping track on loss-realization waves of 52,230 BTC (July 15–18), 42,493 BTC (July 24–28), and 70,028 BTC after July 31. This long-term STH capitulation usually takes time to run its course and has traditionally been a sign of intermediate-term bottoms.
Corporate Treasury Activity: Support Meets Uncertainty
MicroStrategy (Strategy) Continues Accumulation
Corporate balance sheet demand continues to help, as between July 28 and August 3, Strategy (previously MicroStrategy) bought 21,021 BTC at an average price of about $117,256. This raised their overall holdings to about 628,791 BTC, which is more than 3% of the total supply of Bitcoin. Metaplanet, a Japanese company, also bought 463 BTC on August 4, showing that institutions are still interested.
Concerning Wallet Movements Raise Questions
But others who watch the market have noticed some troubling wallet movements from Strategy, like the transfer of 7,382 BTC (worth almost $800 million) to Coinbase Prime in late June without anyone knowing about it. The corporation is still following its long-term holding plan, but these changes have made it unclear whether the market’s biggest corporate holder will sell in the future.
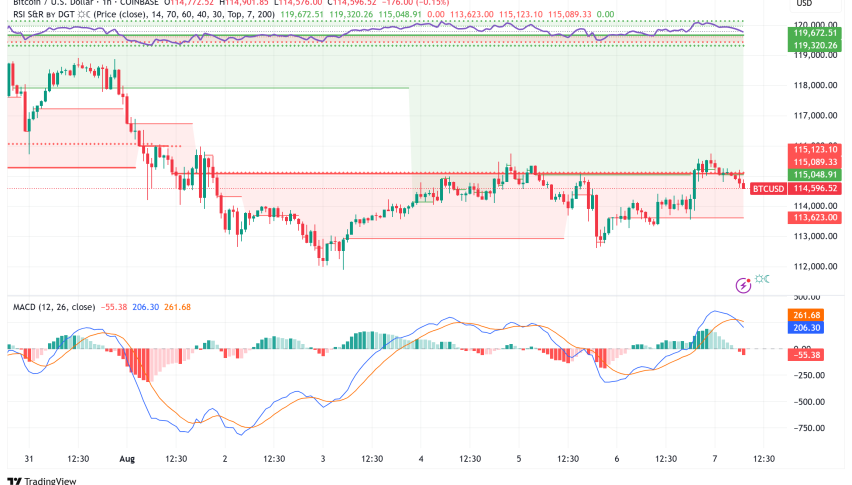
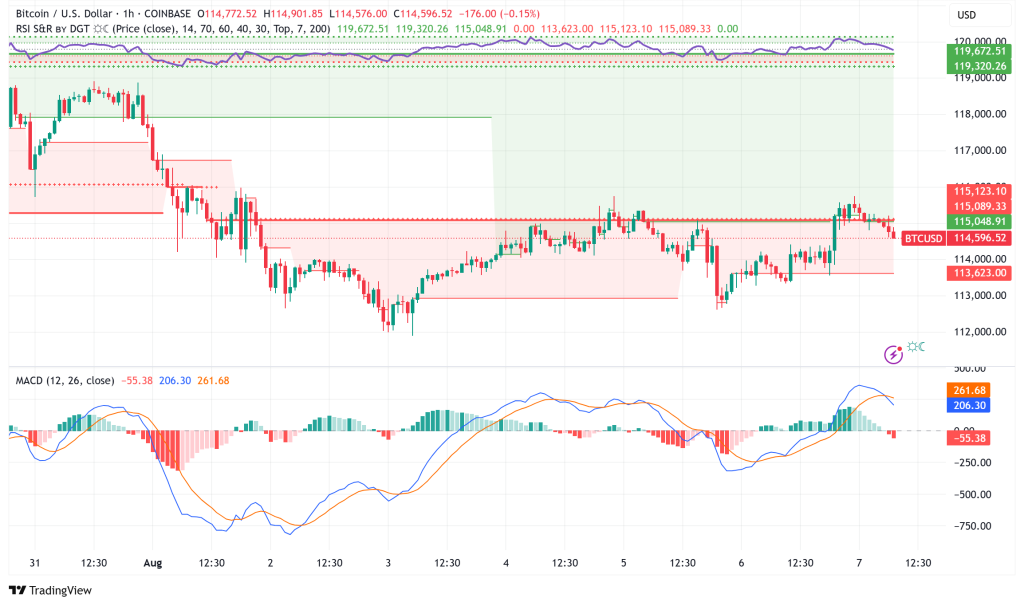
BTC/USD Technical Analysis: Critical Support Zone in Focus
Former All-Time High Becomes Key Battleground
Bitcoin is seeing support around its prior all-time high zone of about $112,000 from a technical point of view. Data on the realized price distribution of on-chain UTXOs shows that there is substantial support in the $108,000-$112,000 zone, where a lot of coins changed hands last time. This mix of technical and on-chain support levels is a big test for the idea that Bitcoin is in a bull market.
Bitcoin ETF Flows Turn Negative
Bitcoin ETF flows have turned negative following 15 weeks of steady inflows, which adds to the pressure on the technical picture. Recent data suggests that around $223 million leaves the market per week. US spot Bitcoin ETFs have had many days of big redemptions, including about $196 million on a recent Tuesday session.
Bitcoin Price Prediction and Outlook
Base Case: Consolidation with Upside Potential
Based on the present technical setup and on-chain dynamics, it looks like Bitcoin will stay in the $108,000–$115,000 region for the time being. The $112,000 level is a very important line in the sand. If the price stays above this level, it would mean that the recent downturn is just a normal retreat in a bull market.
Bullish Scenario: Reclaim of $120,000
If the dollar keeps becoming weaker and the credit markets stay solid, Bitcoin might try to reach the $120,000 level again. If it goes over this level, it will probably aim for the previous all-time high of almost $123,000, but it might also go far higher.
Bearish Scenario: Break Below Support
If the support zone between $108,000 and $112,000 fails, it would be the first major break of a previous breakthrough in this cycle. If this happens, it might lead to a bigger drop toward $90,000-$95,000, especially if ETF outflows keep happening or if companies start selling more than expected.
- Check out our free forex signals
- Follow the top economic events on FX Leaders economic calendar
- Trade better, discover more Forex Trading Strategies
- Open a FREE Trading Account
- Read our latest reviews on: Avatrade, Exness, HFM and XM
Related Articles


Sidebar rates
Related Posts
