Bitcoin Holds Strong Above $111K: On-Chain Metrics Signal Potential Rally Ahead
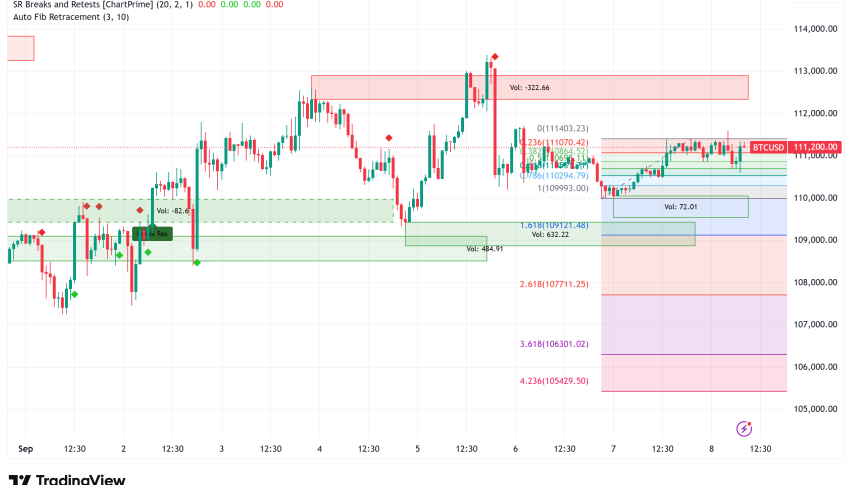
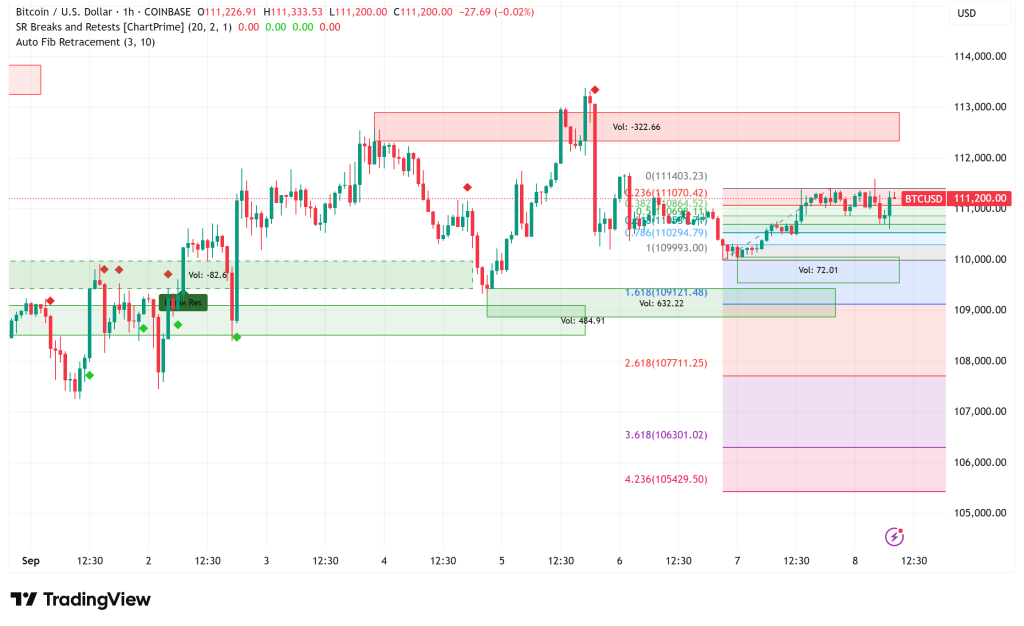
Bitcoin (BTC) showed a lot of strength over the weekend, staying above the important $111,000 level even though it was under a lot of
Quick overview
- Bitcoin remains strong above the $111,000 level, currently valued at $111,203 after a slight gain.
- Technical analysts identify a critical resistance zone between $112,000 and $113,000, with mixed opinions on Bitcoin's short-term direction.
- On-chain metrics indicate a shift in market dynamics, with short-term holders selling at a profit for the first time in 20 days.
- Bitcoin's outlook suggests potential for a breakout towards $150,000, but a drop below $107,000 could test the $100,000 support level.
Bitcoin BTC/USD showed a lot of strength over the weekend, staying above the important $111,000 level even though it was under a lot of adverse pressure earlier in the week. The main cryptocurrency is now worth $111,203, which is a small 1% gain from the previous day. This has made people in the market feel better after Friday’s downturn, which was caused by U.S. job data that was worse than predicted.
BTC/USD Technical Analysis Points to Critical Resistance Zone at $112K-$113K
Bitcoin is at a very important point right now, with technical analysts pointing to a key resistance zone between $112,000 and $113,000. Michaël van de Poppe, a well-known trader, said that Bitcoin’s ability to hold $110,000 support while making a “new higher low” is a good sign that the bull run will continue, as long as it breaks through the $112,000 resistance level.
People still have different opinions about where the market will go in the short run. Trader Cipher X says that if Bitcoin doesn’t get back to $112,000, it might go lower. Crypto Tony, on the other hand, says that Bitcoin could either go up to $113,000 and make new highs or go down to $100,000. The 50-day simple moving average at $115,035 is another big obstacle, and the 200-day SMA at $101,760 is important support for the downside.
Fibonacci Analysis Suggests Limited Downside Risk
Fibonacci retracement levels might help investors who are worried about possible corrections feel better about their investments. ZYN, a well-known trader, says that Bitcoin usually hits its lowest point at the 0.382 Fibonacci level, which is about $100,000 right now. This trend, which was seen in the third quarter of 2024 and the second quarter of 2025, shows that the “worst case scenario” would be a 10% drop before a possible 50% rise beyond $150,000.
The $100,000 level is a psychological support level that also matches up with technical signs. One analyst said that if the price dropped below $107,000, it would go after the $101,000 mark, which is where the 200-day moving average is. This is a “logical area to expect a bounce.”
Bitcoin’s On-Chain Metrics Show Shifting Market Dynamics
Recent examination of the blockchain shows that investors are acting in new ways. The Short-Term Holder Spent Output Profit Ratio (STH-SOPR) has gone back above 1.0 for the first time in 20 days. This means that short-term holders are once again selling at a profit instead of giving up and losing money. This change signals that the market may have taken on too much selling pressure and could be getting ready to move up.
The UTXO Realized Price Distribution (URPD) indicator shows that there are three important support levels: $108,250 (432,000 coins), $104,250 (401,000 coins), and $97,050 (404,000 coins). These levels are important accumulation zones where investors are inclined to buy. On the other hand, $116,963 is the next big barrier level, where about 550,000 coins were bought.
Social Sentiment and Institutional Interest Remain Strong
Santiment’s social media analytics show that Bitcoin is still the most talked-about cryptocurrency. People are mostly talking about its position as digital gold, how institutions are adopting it, and its long-term usefulness as money. The story that Bitcoin is a hedge against inflation and that it is hard to find continues to attract institutional investors, and companies like MicroStrategy are buying it up aggressively.
Bitcoin Price Prediction and Outlook
Bitcoin looks like it could break out above its present levels based on the results of both technical and on-chain analysis. The immediate goal is still the $112,000-$113,000 resistance zone. If the price breaks through this level, Fibonacci estimates predict that it might rise to $150,000.
But if Bitcoin doesn’t hold its current support levels, it could test the $100,000 psychological support level, which would be around 10% lower than where it is now. The fact that several support indicators are lined up around this level, together with historical Fibonacci patterns, implies that this is more likely to be a buying opportunity than the start of a deeper decline.
- Check out our free forex signals
- Follow the top economic events on FX Leaders economic calendar
- Trade better, discover more Forex Trading Strategies
- Open a FREE Trading Account
- Read our latest reviews on: Avatrade, Exness, HFM and XM
Related Articles


Sidebar rates
Related Posts
