Bitcoin Consolidates Above $108K as Futures Traders Signal Renewed Confidence
Analysis suggests institutional accumulation continues while key resistance zone at $110K-$115K will determine Bitcoin's next major moves
Quick overview
- Bitcoin is currently trading above $108,000 but has dropped 1.7% in the last 24 hours as it navigates a critical market battleground.
- The crypto market is showing signs of recovery after significant volatility in October, with Bitcoin futures open interest rising to over $32 billion.
- There is a tug-of-war between long-term holders selling their coins and institutions buying up supply, impacting Bitcoin's price dynamics.
- The market outlook remains cautious, with key support levels at $107,000 and resistance between $110,000-$115,000 determining Bitcoin's near-term direction.
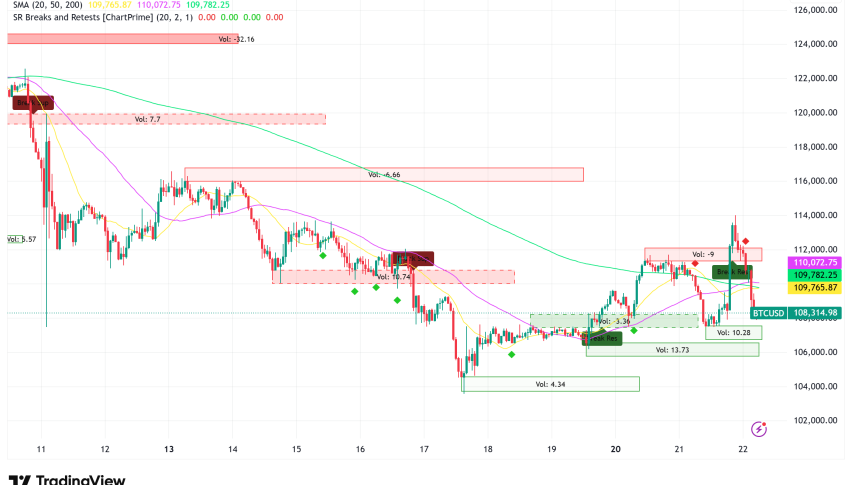
At the time of writing, Bitcoin BTC/USD is trading above $108,000. It has dropped 1.7% in the last 24 hours as the cryptocurrency moves through a key battleground that analysts think may determine the direction of the current market cycle.
Futures Markets Show Signs of Recovery After October Volatility
The crypto market has bounced back after the terrible sell-off on October 10, when over $20 billion in futures liquidations wiped out highly leveraged positions. CoinGlass’s most recent data shows that Bitcoin futures open interest has risen beyond $32 billion, up from a low of $28 billion on October 11. This is a clear sign that traders are slowly getting back into the market.
According to Hyblock’s analysis, the latest rise from $107,453 to $114,000 was in line with Bitcoin’s four-hour anchored open interest and cumulative volume delta turning positive. Along with this price movement, BTC’s financing rate went increased, which suggests that the breakout attempt was driven by the futures markets. But the increase stopped because the price took in topside liquidity in the $114,000-$115,000 range, which stopped a long-term breakthrough.
Rakesh Upadhyay, a technical expert, says that traders are getting more comfortable taking on risk. However, selling keep closing winning positions at the highs of the day, while bulls protect the important $107,000 support level. This situation has led to a tug-of-war between opposing forces in what many people deem Bitcoin’s most significant price zone of the cycle.
The $110K-$115K Battleground: A Decisive Moment for the Bull Market
Bitcoin Vector, an institutional-grade analyst, says that the $110,000-$115,000 level is Bitcoin’s “decisive battleground” that might set the course for the whole cycle. Spot demand has been poor lately, at first because of rising trade tensions between the US and China. But as geopolitical worries relaxed, BTC was able to go back above the $110,000 mark.
But the momentum is still negative and flat. Without steady inflows and strong spot demand, the bullish structure could fade fast, which could lead to another dip in Bitcoin. On the other hand, if demand stays strong and momentum becomes positive, BTC might move farther into the battlefield zone, setting the stage for a possible breakout toward prior all-time highs.
Sykodelic, a full-time crypto trader, has made a hopeful forecast that Bitcoin might reach all-time highs again by the end of October. He says that the market is still in a “disbelief phase,” where fear rules. This is where big swings up have happened in the past. Bitcoin has been climbing back above the 4-hour 50-period Simple Moving Average. In the past, every time this level was successfully retested as support, the price proceeded to rise.
BTC Whale Activity Raises Questions About Near-Term Direction
A Bitcoin whale with $11 billion just opened a $235 million 10x leveraged short position when Bitcoin was trading at $111,190. This makes the market outlook more complicated. This same individual made almost $200 million in profit from the crash in early October by using identical leveraged short strategies. The whale is currently $2.6 million in the hole on the trade, which would be closed if Bitcoin’s price goes beyond $112,368.
On the other hand, CryptoQuant says that newer Bitcoin whales have a total unrealized loss of more than $6.95 billion because the current market drop brought Bitcoin’s price down below its average cost base of about $113,000. This group owns over 45% of the whole whale realized cap, therefore what they do is quite important for price action in the immediate future.
Supply Dynamics: Long-Term Holders vs. Institutional Buyers
BitBull, the MGBX_EN ambassador, says that the Bitcoin market is in a supply tug-of-war between two formidable forces. Long-term holders (LTHs) have been steadily giving away their coins, while institutions are rapidly buying up supply through Spot ETFs and Digital Asset Treasuries (DATs), which have quietly grown to possess more than $120 billion.
Even while there is a lot of demand from institutions—Spot ETFs took in tens of thousands of coins this quarter—LTHs are selling quicker than institutions can take in the supply. When Bitcoin’s LTH distribution speeds up, it usually loses short-term momentum. This pattern says that the current situation isn’t necessarily bearish, but it does mean that the upside may be limited for a while until selling pressure eases and long-term holders start buying again.
Bitcoin Price Prediction: Cautious Optimism with Key Levels to Watch
Bitcoin looks like it will continue to consolidate based on current technical indications and market trends. There is also a chance that it might make a big move in either way. Several important things will determine the next steps:
Bullish Scenario (Probability: Moderate)
If Bitcoin can stay above $107,000 and get back into the $110,000-$115,000 region with confidence, backed by rising spot demand and good funding rates, it is likely that it will move into $120,000-$125,000. Several experts have set estimates for the end of the year between $145,000 and $168,000, depending on continued institutional buying and good macroeconomic conditions, such as possible rate reduction by the Federal Reserve.
Bearish Scenario (Probability: Moderate)
If the $107,000 support level doesn’t hold, especially on a daily close basis, it might lead to a retest of the $100,000-$104,000 zone. Some experts who go against the grain, like Elliott Wave expert Jon Glover, have said that the bull market that started in early 2023 may have ended with the October top near $126,000. This could lead to a long drop toward $70,000 or below that lasts until 2026.
Base Case Outlook
In the next few weeks, the most likely thing to happen is that trading will be choppy in the $105,000 to $115,000 region while the market processes recent volatility and waits for stronger signals about where the market is headed. Bitcoin’s path for the rest of 2025 will probably depend on how this consolidation phase ends, whether it breaks out above $115,000 and stays there or breaks down below $105,000.
- Check out our free forex signals
- Follow the top economic events on FX Leaders economic calendar
- Trade better, discover more Forex Trading Strategies
- Open a FREE Trading Account
- Read our latest reviews on: Avatrade, Exness, HFM and XM
Related Articles


Sidebar rates
Related Posts
