Ethereum Hovers at $3,790 as Market Eyes Liquidity Sweep Before Potential 10% Rally
Ethereum is currently trading around $3,790, which is 2.2% less than it was 24 hours ago. It is the second-largest crypto by market cap and
Quick overview
- Ethereum is currently trading at $3,790, down 2.2% in the last 24 hours, with analysts identifying key liquidity levels for potential price movements.
- A significant liquidity cluster around $3,750 may act as support, while resistance is noted between $3,900 and $4,200, indicating a possible short-term gain of 10%.
- Despite recent volatility, institutional confidence remains strong, with $600 million in withdrawals from exchanges and a net inflow of 550,000 ETH in October.
- Onchain metrics suggest a potential price reversal, with increased altcoin activity and a high number of short positions indicating a possible bounce for Ethereum.
Ethereum ETH/USD is currently trading around $3,790, which is 2.2% less than it was 24 hours ago. It is the second-largest crypto by market capitalization and is trading in a limited price range. Even if the market is weak right now, technical analysts are finding important levels that could lead to a big rise in the next several weeks.
ETH/USD Technical Analysis Points to Strategic Liquidity Levels
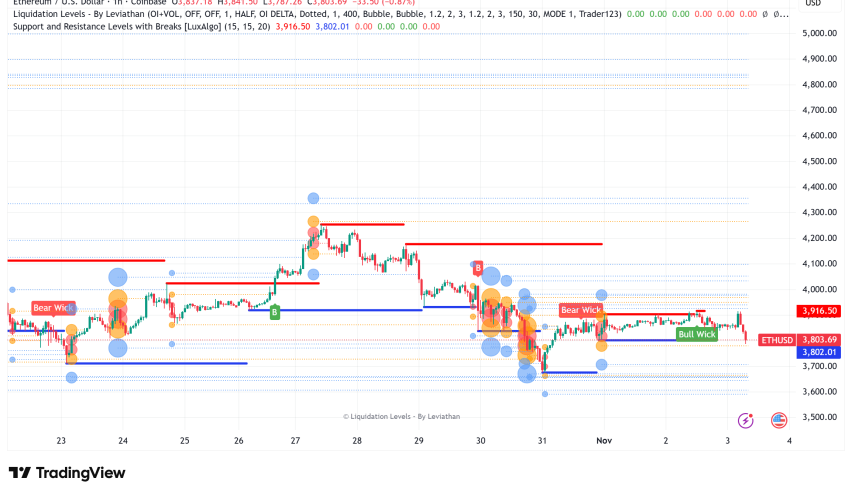
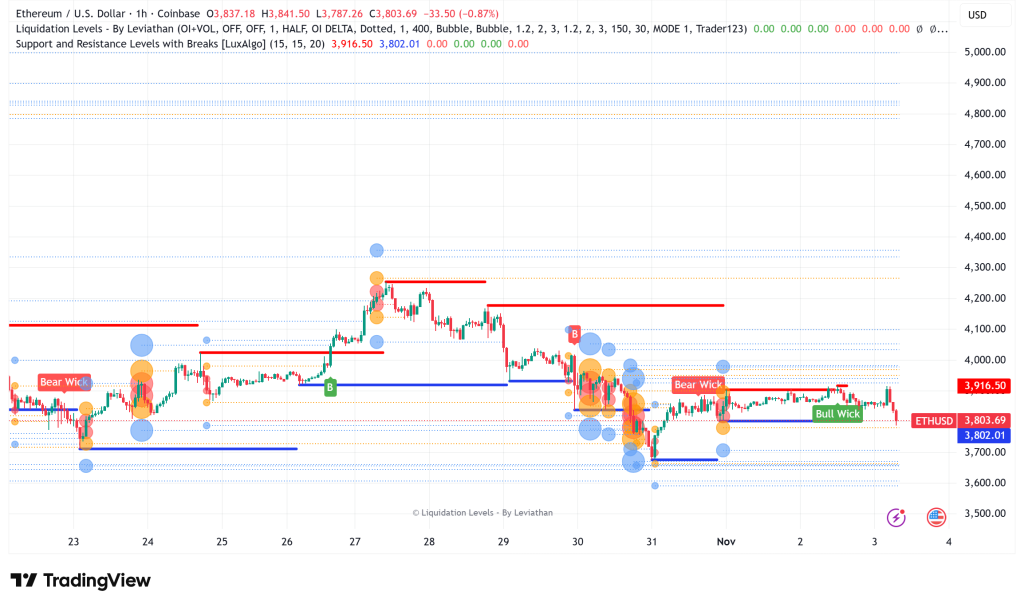
Ted Pillows, a well-known market analyst, has used Coinglass’s liquidity heatmap data to find important price zones. The study shows that there is a lot of resting liquidity on both sides of the present price action. There are a lot of limit orders between $3,900 and $4,200. This upper band is a strong resistance zone where traders are getting ready for possible selling, thus it is a key level that bulls need to retake in any long-term rally.
On the other hand, there is a large liquidity cluster around $3,750 that could operate as both a price magnet and a major support level. Pillows says that Ethereum might be getting ready for a typical liquidity sweep. This is when the price drops into places with a lot of liquidity to trigger stop losses and fill bids before going back up strongly. If this happens, there could be a temporary drop to $3,750 before a strong recovery that targets the $3,900–$4,200 resistance area. This could mean a short-term gain of about 10% from where we are now.
Institutional Confidence Remains Strong Despite Volatility
Ethereum had $600 million in withdrawals from centralized exchanges this week, which adds weight to the optimistic thesis. This is similar to what happened with Bitcoin, where major holders moved assets into long-term storage. This pattern usually means that institutions are buying more and that there is less selling pressure on exchanges.
Sentora, a company that analyzes blockchain data, says that Ethereum treasury businesses saw a net inflow of 550,000 ETH in October, even though the currency lost 13.34% of its value that month. This number isn’t as high as the astounding 1.5 million ETH inflows in August, but it shows that people still believe in Ethereum’s long-term value proposition, even when the market is tough.
Onchain Metrics and Sentiment Indicators Suggest Potential Reversal
Santiment said that big short positions have been building up on exchanges as traders become more and more scared. In the past, these kinds of situations have often come before big price recovery for Ethereum. The analytics platform says, “When major shorts are in charge, the chance of a bounce is high.”
CryptoOnChain has also pointed out that Ethereum’s altcoin activity recently reached an all-time high. This shows that more people are using the network and developers are getting back to work. This record-breaking activity on the blockchain gives the ecosystem’s growth path a strong underlying base.
Even though people are feeling negative in the short term (the worry & Greed Index is at 29, which means worry), Ethereum had 15 green days out of 30 in the past month, with 6.2% volatility, which shows that traders are being careful but stable.
Ethereum Price Prediction and Regulatory Wildcards
CoinCodex’s most recent prediction model says that ETH might go up 11.66% to $4,272.40 by November 30, 2025. This is in line with the technical resistance zone found by liquidity analysis. However, changes in the law could have a big effect on this path.
If the Clarity Act passes, it could help Ethereum, but if it doesn’t, it could cause short-term drops. As traders deal with these unknowns, the combination of technical setup, institutional accumulation patterns, and high onchain activity suggests that November could be an important turning point for ETH, possibly leading to a bigger breakout in December.
- Check out our free forex signals
- Follow the top economic events on FX Leaders economic calendar
- Trade better, discover more Forex Trading Strategies
- Open a FREE Trading Account
- Read our latest reviews on: Avatrade, Exness, HFM and XM
Related Articles


Sidebar rates
Related Posts
