Bitcoin Holds Above $91,000 But Faces Critical Test as Institutional Selling Pressure Persists
Bitcoin (BTC) is now worth more than $91,000, which is a big jump from its recent lows of around $80,000. Analysts, on the other hand, say
Quick overview
- Bitcoin's price has surged to over $91,000, recovering from recent lows of around $80,000, but analysts warn of an unstable market structure.
- Weak spot demand and low liquidity are hindering the sustainability of this rally, with significant selling pressure from institutions.
- The futures market is primarily driven by short covering rather than new long positions, indicating a lack of confidence among buyers.
- Bitcoin is at a critical juncture, with potential resistance between $95,000 and $97,000, but risks a drop to the $81,000 level if market conditions do not improve.
Bitcoin BTC/USD is now worth more than $91,000, which is a big jump from its recent lows of around $80,000. Analysts, on the other hand, say that the market structure behind this bounce is become more and more unstable. The top cryptocurrency has gotten back to the psychologically key $90,000 mark. However, a combination of weak spot demand, dwindling liquidity, and ongoing institutional selling pressure makes it hard for bulls to keep this rally going.
Cost-Basis Support Provides Floor But Lacks Active Buying Interest
A lot of BTC were stored around $84,000, which created a strong on-chain support level. This is what has been supporting the recent price action. This historical buildup has produced a “floor” that has stopped prices from falling any further. However, on-chain data shows a worrying trend: even while there is a lot of activity at this level, participation above this level is still quite low.
Order books still don’t have much depth, and prices keep moving through areas where there aren’t many buyers. The market needs to stop relying on passive past accumulation and start producing active, continuous demand if Bitcoin is going to stay above $90,000. There isn’t enough spot absorption between $84,000 and $90,000 right now to enable a solid bullish continuation.
BTC’s Liquidity Crisis Mirrors Early 2022 Post-ATH Weakness
The liquidity situation is probably the most worrying for bulls. Bitcoin is still trading below the short-term holder (STH) cost basis of $104,600, which means that the market is not very liquid, like it was after the last all-time high in Q1 2022. Short-term holders are losing an average of $403 million each day, which shows that investors are giving up instead of building up strength.
The STH Profit/Loss Ratio has dropped to only 0.07x, which means that demand momentum has pretty much disappeared. This measure adds to the bearish pressure because novice traders are losing a lot of money. For any substantial change in trend, realized losses must start to go down as STH profitability rises beyond neutral levels. Analysts say that without a liquidity reset like this, the market is still open to drifting toward the “True Market Mean” of about $81,000.
Futures Market Driven by Short Covering, Not Fresh Long Positions
When you look at derivatives activity, the technical picture gets much more complicated. The latest surge toward $91,000 has mostly been caused by short covering, not new long exposure. This is an important difference for sustainability. Open interest has kept going down, cumulative volume delta has stayed the same, and shorts liquidation pockets pushed the price through important resistance levels at $84,000, $86,000, and $90,000.
Funding rates that are close to neutral show that the derivatives market is cautious. Leverage is slowly going away, but buyers aren’t stepping in with confidence. To see a supporting trend shift, open interest on the long side would need to be rebuilt, and funding would need to stay positive because of real demand instead of forced short exits.
Institutional Selling Shows Signs of Easing But Remains Negative
One important metric is flashing danger signs: the Coinbase Premium Index is still negative, which means that US institutions and professional investors are still net sellers. This measure compares the price of Bitcoin on Coinbase, which is popular with institutional investors, to the price on Binance, which is more popular with regular people. The constant negativity shows that professional traders are still selling Bitcoin more aggressively than retail traders, even if panic selling peaked around November 21.
But there are signs of hope. Since the end of November, institutional selling has clearly slowed down. The Coinbase Premium hasn’t turned positive yet, but the level of negativity has gone down a lot. This relaxation comes at the same time as fewer spot ETF outflows, which had been making people feel worse. If this tendency keeps up, it might provide prices the space they need to stabilize.
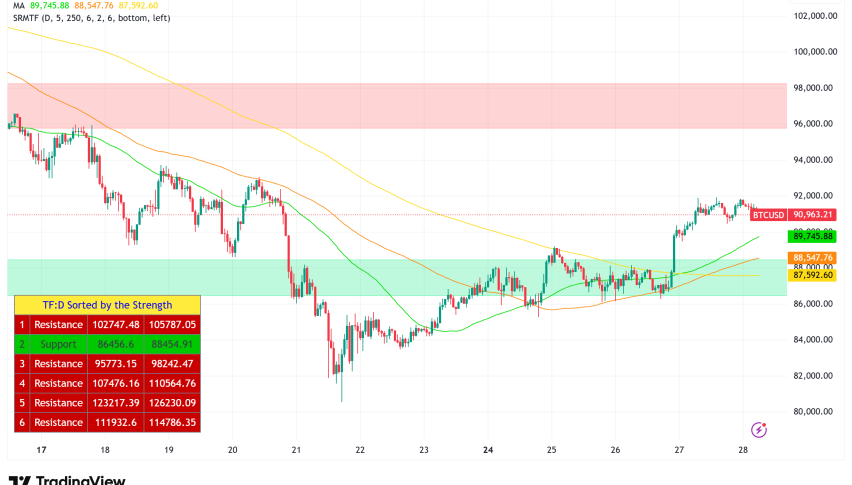
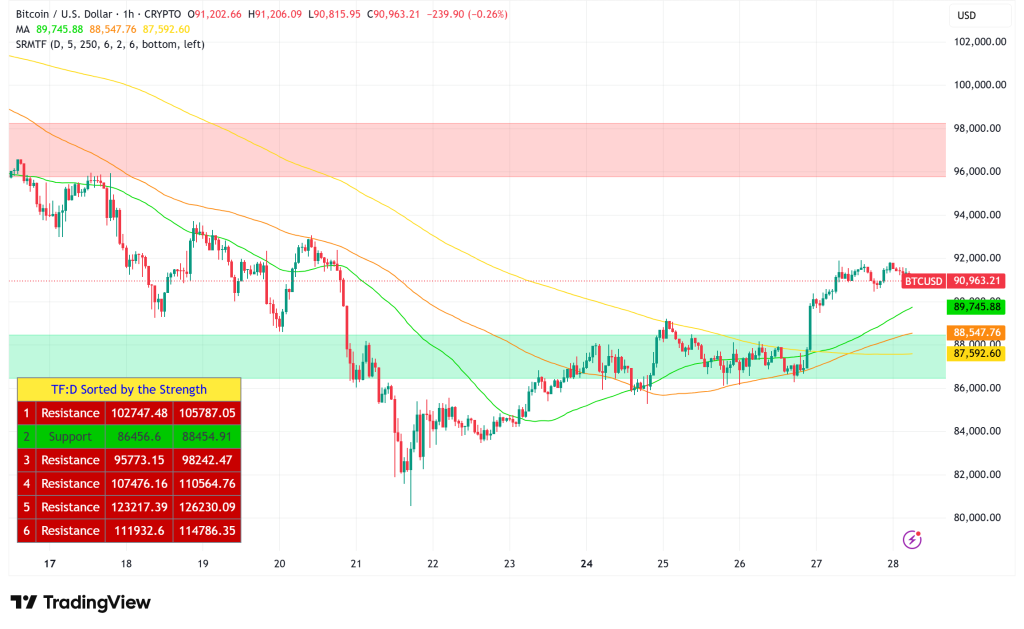
BTC/USD Technical Analysis: Bounce From 200-Day MA But Key Resistance Ahead
From a technical frame of view, Bitcoin has bounced sharply off the 200-day moving average, which has historically been a strong support level during severe drops. This bounce brought the price back down from the $80,000 range to where it is now. BTC is still below the 50-day and 100-day moving averages, which have both shifted downward. This shows that it is still weak in the short term.
Volume analysis shows that there was a lot more selling pressure during the downturn than purchasing pressure during the rebound. This suggests that this may be more of a relief rally than a verified reversal. The chart shows clear rejection wicks below $85,000, which means that buyers are interested at lower prices, but it’s not obvious if this will last.
Bitcoin Price Prediction: Critical Juncture Between $95,000 Breakthrough or $81,000 Retest
Bitcoin is at a very important point in its history. To keep this rally going, bulls need to do a few things: Spot demand needs to get a lot better above the $84,000 cost basis. Liquidity circumstances need to stabilize as realized losses go down, and the futures markets need meaningful long-side accumulation instead of more short covering.
In the next week or two, if institutional selling keeps going down and spot demand goes up, Bitcoin might test resistance between $95,000–$97,000. But the structure is still weak because it hasn’t been able to get back above the 100-day moving average near $103,000.
The base case is that the market will stay between $88,000 and $94,000 as it looks for balance and waits for clearer catalysts to move in one direction or the other. This range lets the market structure slowly get better.
Bearish scenario: If spot absorption doesn’t happen and liquidity keeps getting worse, the $81,000 “True Market Mean” might be tested again, which could lead to another wave of long liquidations.
- Check out our free forex signals
- Follow the top economic events on FX Leaders economic calendar
- Trade better, discover more Forex Trading Strategies
- Open a FREE Trading Account
- Read our latest reviews on: Avatrade, Exness, HFM and XM